External business of Monetary Financial Institutions operating in the UK - 2022 Q2
Key points
- Adjusted for exchange rate movements, external liabilities increased by $79.5 billion during 2022 Q2. The largest increases in liabilities were to International Organisations and Other, and Offshore Centres, with the largest increases to Offshore Centres against Hong Kong and Cayman Islands.
- Adjusted for exchange rate movements, external claims increased by $94.3 billion during 2022 Q2. The largest increase in claims was on Developed Countries, with the largest increases on France, Japan and the United States.
Table A: Regional breakdown of external claims and liabilities
US$ billions - Not seasonally adjusted
Exchange rate adjusted flows | Amounts outstanding | |||
Q4 | Q1 | Q2 | End-Q2 2022 | |
Liabilities to: | 2021 | 2022 |
| |
Developed countries | 74.8 | 133.5 | 8.6 | 3,314.0 |
Offshore centres | 50.1 | 34.6 | 34.7 | 757.0 |
Developing countries | 3.0 | 29.1 | - 6.2 | 573.8 |
International Organisations & Other | 36.8 | - 32.8 | 42.4 | 944.6 |
Total | 164.7 | 164.5 | 79.5 | 5,589.4 |
Claims on: | ||||
Developed countries | 94.7 | 194.2 | 79.8 | 4,128.4 |
Offshore centres | - 2.5 | 21.4 | - 11.7 | 556.9 |
Developing countries | 35.3 | - 7.4 | - 6.7 | 437.4 |
International Organisations & Other | - 2.4 | 28.4 | 32.9 | 204.9 |
Total | 125.1 | 236.6 | 94.3 | 5,327.6 |
Footnotes
Chart 1: Exchange rate adjusted flows of liabilities by counterpart sector and region 2022 Q2 (US$ billions)

Chart 2: Exchange rate adjusted flows of claims by counterpart sector and region 2022 Q2 (US$ billions)
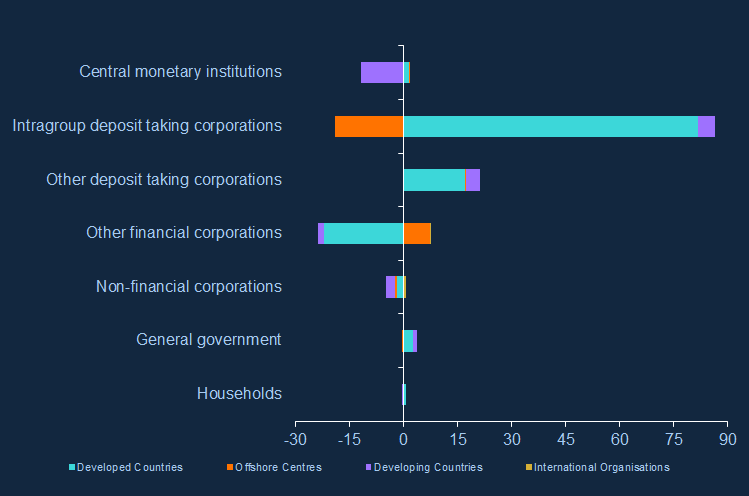
Exchange rate adjusted flows of external liabilities and claims: Developed Countries
Exchange rate adjusted flows vis-à-vis Developed Countries – 2022 Q2
(US$ billions) - Not seasonally adjusted
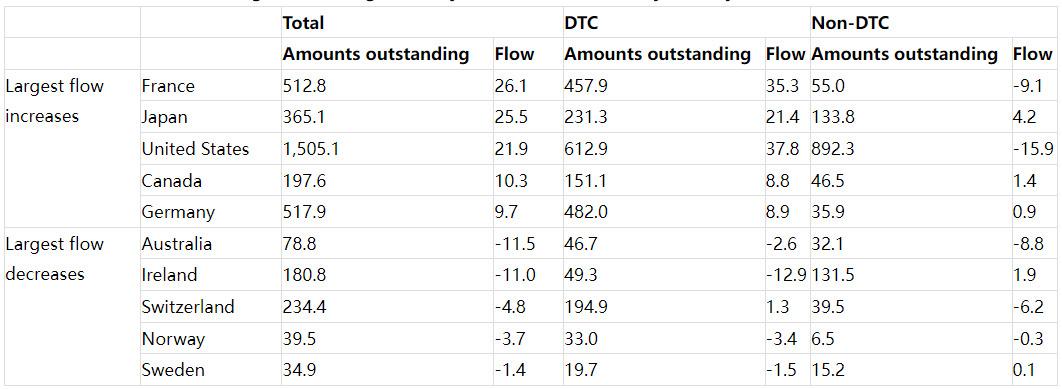
Chart 3: Flows of liabilities by country (5 largest increases/decreases)
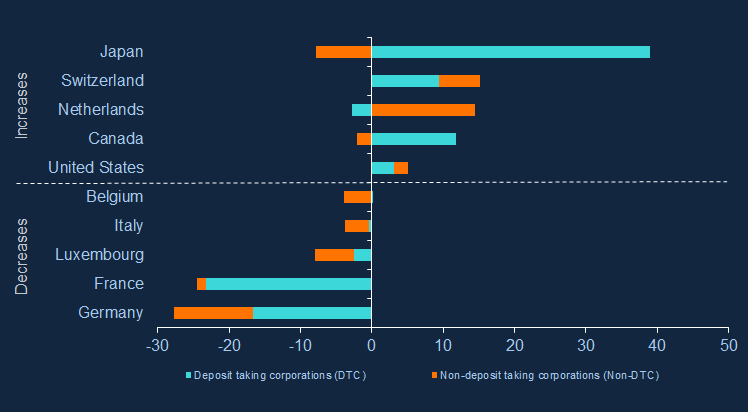
Chart 4: Flows of claims by country (5 largest increases/decreases)
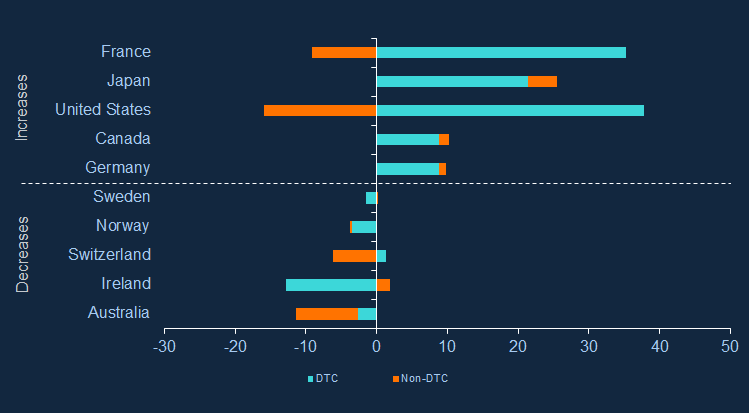
Table B: Amounts outstanding and exchange rate adjusted flows of liabilities by country – 2022 Q2 (US$ billions)
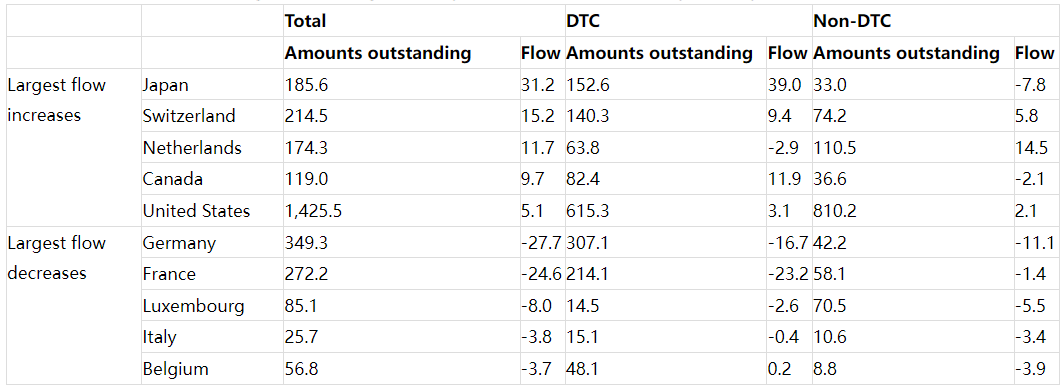
Table C: Amounts outstanding and exchange rate adjusted flows of claims by country – 2022 Q2 (US$ billions)
Exchange rate adjusted flows of external liabilities and claims: Offshore Centres
Exchange rate adjusted flows vis-à-vis Offshore Centres – 2022 Q2
(US$ billions) - Not seasonally adjusted
Chart 5: Flows of liabilities by country (5 largest increases/decreases)
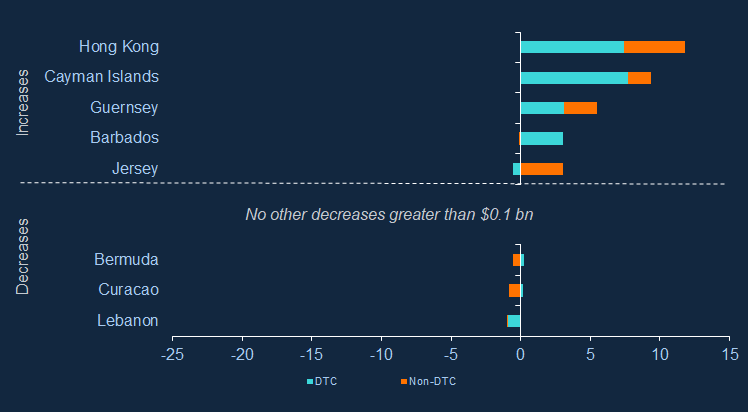
Chart 6: Flows of claims by country (5 largest increases/decreases)

Table D: Amounts outstanding and exchange rate adjusted flows of liabilities by country – 2022 Q2 (US$ billions)
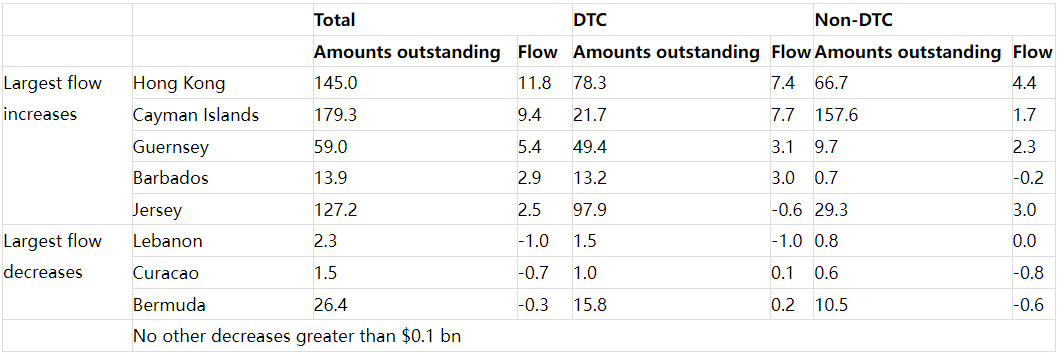
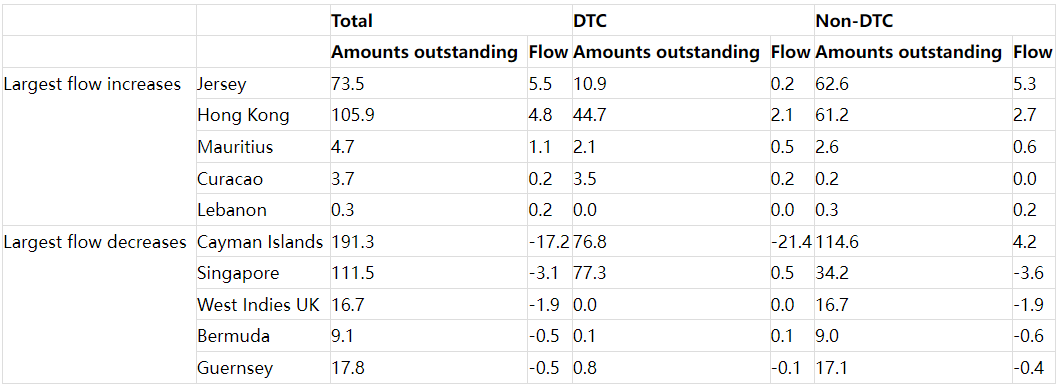
Table E: Amounts outstanding and exchange rate adjusted flows of claims by country – 2022 Q2 (US$ billions)
Exchange rate adjusted flows of external liabilities and claims: Developing Countries
Exchange rate adjusted flows vis-à-vis Developing Countries – 2022 Q2
(US$ billions) - Not seasonally adjusted
Chart 7: Flows of liabilities by country (5 largest increases/decreases)
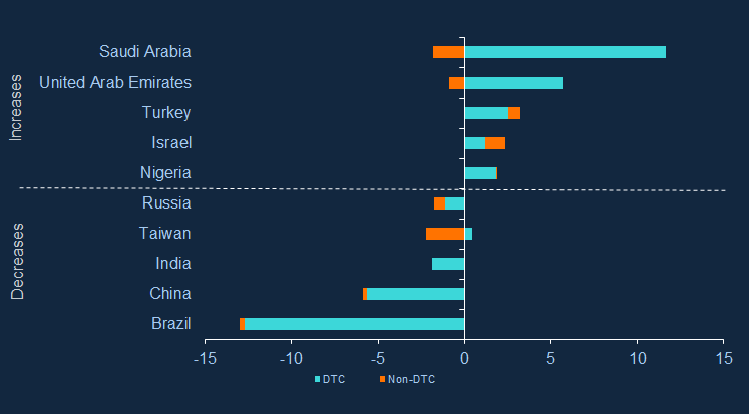
Chart 8: Flows of claims by country (5 largest increases/decreases)
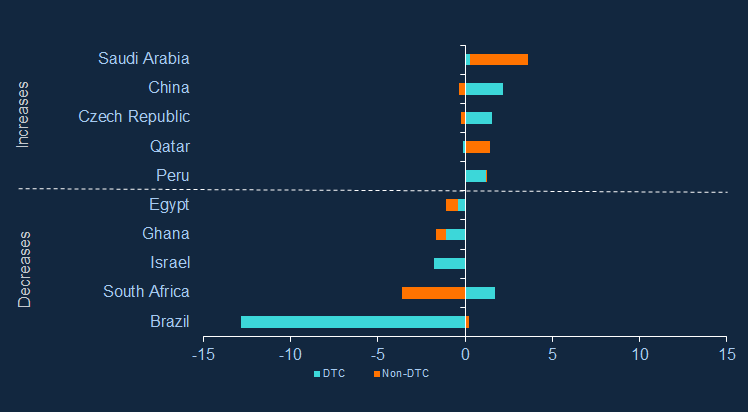
Table F: Amounts outstanding and exchange rate adjusted flows of liabilities by country – 2022 Q2 (US$ billions)
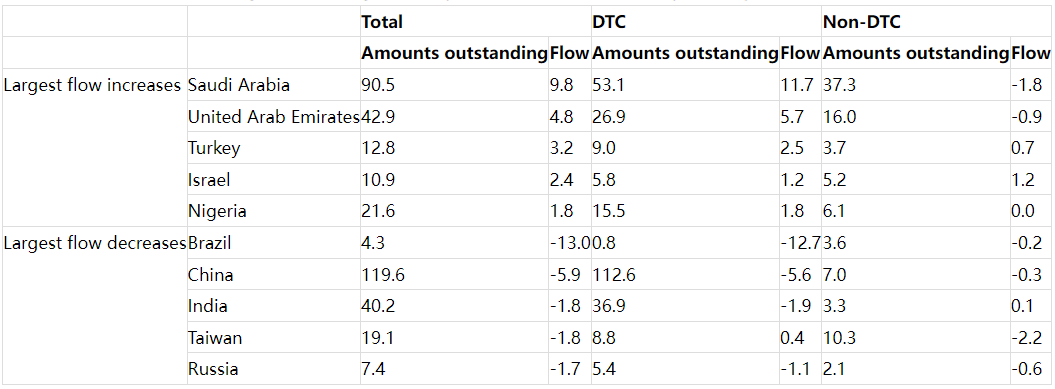
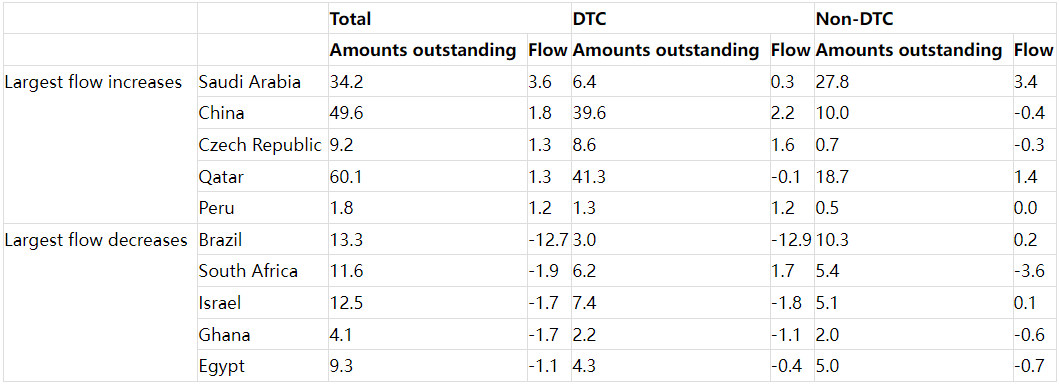
Table G: Amounts outstanding and exchange rate adjusted flows of claims by country – 2022 Q2 (US$ billions)








First, please LoginComment After ~