HKTDC Export Index 1Q23: Sharp Rebound in Export Confidence as China Re-opens
- ♦The HKTDC Export Index rose significantly – by 9.3 points, to 39.0 – for the first quarter of 2023 (1Q23), in tandem with the re-opening of mainland China's borders, the full benefits of which are expected to materialise over the coming months.
- ♦Mainland China (47.9) overtook Japan (46.9) as the most upbeat market, followed by ASEAN (44.8). Sentiment towards the US and EU markets also improved.
- ♦All major sectors recorded improvements. The most upbeat sector was clothing, which returned to an expansionary 51.5 (up by 27.7 points), followed by toys at 47.9 (up 19.0) and timepieces at 47.5 (up 10.7).
- ♦The Trade Value Index increased by 8.8 points to 48.0, a broad-based improvement across all sectors. Toys, timepieces and clothing returned to the expansionary zone at 51.8, 51.0 and 50.7 respectively.
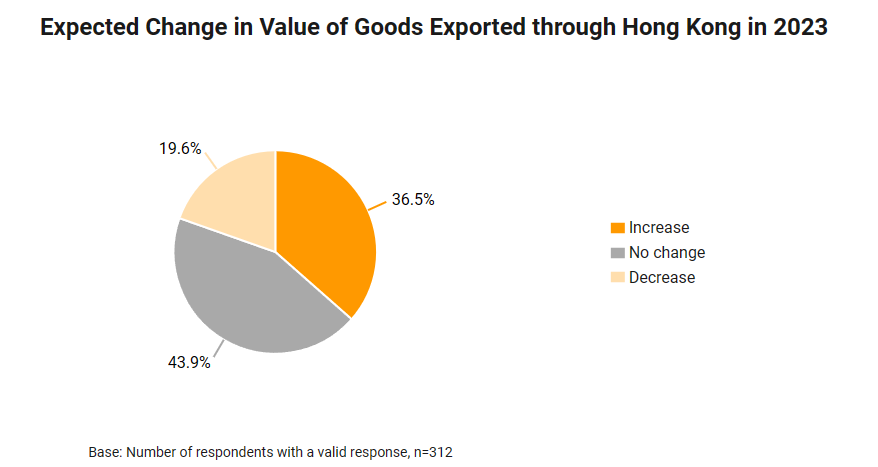
- ♦Shortly after the normalisation of cross-boundary land cargo transportation, 36.5% of exporters reported to increase shipments through Hong Kong. This was driven primarily by end-user requests and a preference for storage, sub-packaging and processing to be done in Hong Kong.
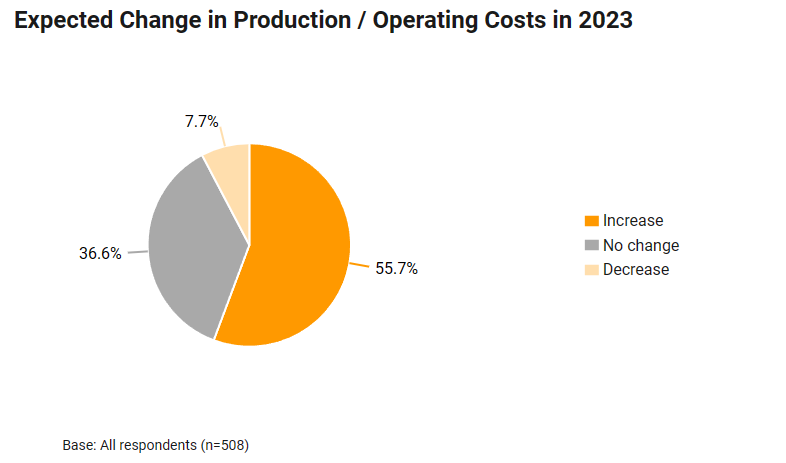
- ♦In terms of production and operational costs, a majority of respondents (55.7%) expected an increase in costs, while 36.6% predicted stable costs and 7.7% foresaw lower costs.
- ♦In 1Q23, exporters focused more on cash-flow management (39.9%, up 5.3 percentage points), e-commerce efforts (36.3%, up 7.5 percentage points), increasing value-added services (31.6%, up 6.6 percentage points), and diversify to new overseas markets (30.5%, up 7.5 percentage points).
For 1Q23, the HKTDC Export Index rose to 39.0, a 9.3‑point rebound from the 29.7 reported for 4Q22. This represents a significant improvement in business sentiment among Hong Kong exporters in step with the resumption of Hong Kong‑mainland cross‑boundary land transportation in mid‑December and the re‑opening of the mainland’s border in early February. These developments are expected to further enhance Hong Kong’s trade outlook over the coming months as their positive impact gradually fully materialises.
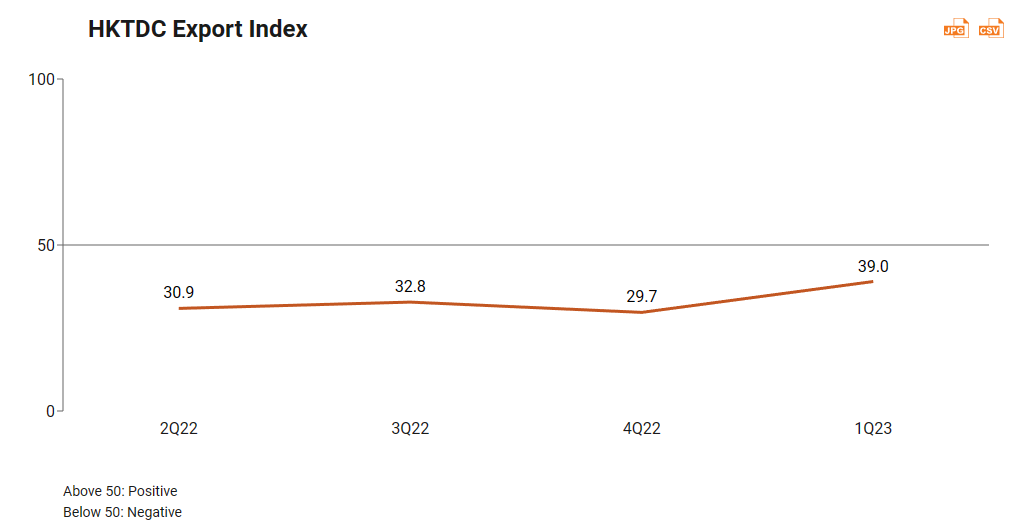
All major sectors recorded improvements. Clothing returned to expansionary territory at 51.5, representing the largest positive swing (up 27.7 points). Significant improvements were also seen for toys (up 19.0 to 47.9) and timepieces (up 10.7 to 47.5), followed by jewellery (up 12.5 to 43.3). Export sentiment for the electronics sector was the lowest at 38.2 (up 8.7).
Period | HKTDC | Electronics | Clothing | Toys | Jewellery | Timepieces | Machinery |
1Q23 | 39.0 | 38.2 | 51.5 | 47.9 | 43.3 | 47.5 | 42.9 |
4Q22 | 29.7 | 29.5 | 23.8 | 28.9 | 30.8 | 36.8 | 38.3 |
3Q22 | 32.8 | 32.7 | 31.2 | 37.0 | 44.2 | 33.8 | 34.9 |
2Q22 | 30.9 | 30.4 | 33.4 | 38.7 | 34.3 | 34.6 | 37.7 |
Sentiment towards the mainland China market improved markedly, rising 3.5 points to top the list at 47.9, ahead of Japan at 46.9 and ASEAN at 44.8. Expectations for the US (up 4.2 to 44.4) and the EU (up 1.6 to 42.0) also improved as consumer spending remained resilient and inflation showed signs of easing.
HKTDC Export Index | US | EU | Japan | Mainland China | ASEAN |
1Q23 | 44.4 | 42.0 | 46.9 | 47.9 | 44.8 |
4Q22 | 40.2 | 40.4 | 47.2 | 44.4 | 43.5 |
3Q22 | 41.1 | 40.5 | 48.4 | 45.8 | 46.9 |
2Q22 | 41.2 | 42.3 | 47.6 | 43.1 | 43.3 |
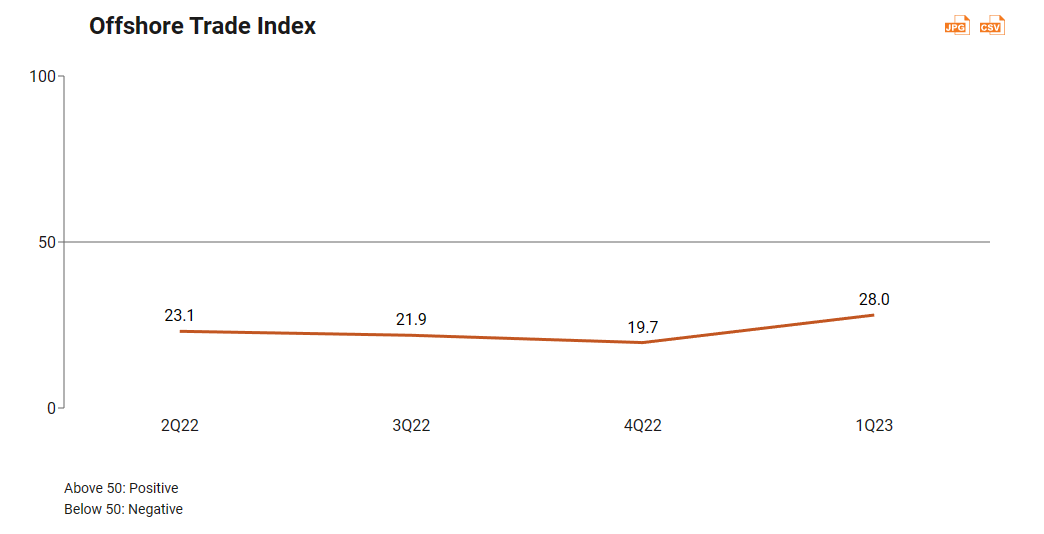
The Offshore Trade Index, which tracks sentiment around shipments not passing through Hong Kong but managed by businesses within the city, increased by 8.3 points in 1Q23, rising to 28.0.
The Trade Value Index rose by 8.8 points, meanwhile, to 48.0, indicating that unit export prices are expected to stabilise after falling for two consecutive quarters. Industry sub‑indices showed improvements across the board. Toys, timepieces and clothing all returned to the expansionary zone at 51.8, 51.0 and 50.7 respectively.
Period | Trade Value Index | Electronics | Clothing | Toys | Jewellery | Timepieces | Machinery |
1Q23 | 48.0 | 47.8 | 50.7 | 51.8 | 46.6 | 51.0 | 48.8 |
4Q22 | 39.2 | 39.1 | 34.9 | 37.3 | 39.4 | 44.6 | 44.8 |
3Q22 | 40.2 | 40.2 | 37.4 | 46.1 | 48.6 | 36.8 | 39.2 |
2Q22 | 51.7 | 51.8 | 49.0 | 53.2 | 54.4 | 51.0 | 50.3 |
The Procurement Index remained subdued at 28.4 (down 0.5), but momentum varied across sectors. The sub‑indices for clothing (up 6.9), jewellery (up 5.8) and toys (up 3.5) improved, while machinery was stable and timepieces (down 4.0) and electronics (down 0.8) declined.
Period | Procurement Index | Electronics | Clothing | Toys | Jewellery | Timepieces | Machinery |
1Q23 | 28.4 | 27.8 | 36.1 | 30.3 | 34.6 | 33.3 | 35.2 |
4Q22 | 28.9 | 28.6 | 29.2 | 26.8 | 28.8 | 37.3 | 35.2 |
3Q22 | 24.3 | 24.0 | 25.7 | 29.6 | 32.7 | 25.5 | 27.8 |
2Q22 | 25.0 | 24.6 | 27.7 | 33.8 | 23.5 | 28.8 | 30.2 |
By contrast, the Employment Index rose by 7.3 points to 47.6, with improving employment prospects seen across all key sectors. Timepieces (up 19.6 points to 62.7), clothing (up 21.3 points to 59.9) and toys (up 15.5 points to 52.8) all returned to expansionary territory, signalling the likelihood of burgeoning recruitment activity.
Period | Employment Index | Electronics | Clothing | Toys | Jewellery | Timepieces | Machinery |
1Q23 | 47.6 | 47.0 | 59.9 | 52.8 | 45.2 | 62.7 | 45.1 |
4Q22 | 40.3 | 40.3 | 38.6 | 37.3 | 38.5 | 43.1 | 44.4 |
3Q22 | 41.8 | 41.7 | 42.1 | 46.5 | 47.1 | 37.3 | 42.0 |
2Q22 | 45.3 | 45.4 | 46.5 | 43.0 | 45.1 | 42.3 | 43.2 |
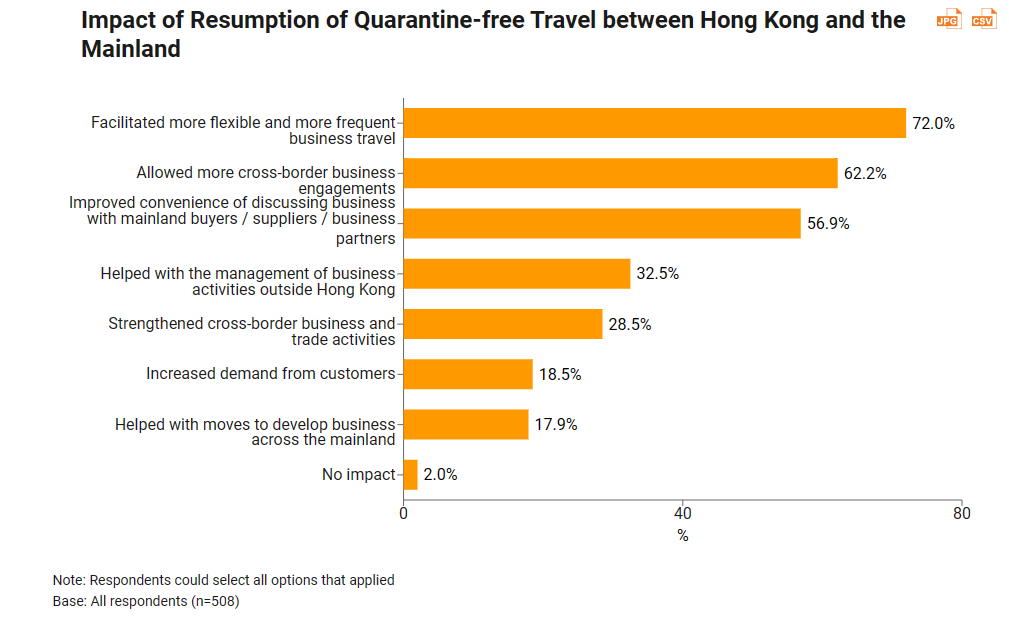
Following the resumption of quarantine‑free travel between Hong Kong and the mainland in early January 2023, an overwhelming majority of respondents (98%) reported a positive impact on business. In this regard, they particularly highlighted more flexible and frequent business travel (72.0%) and cross‑border business engagements (62.2%), as well as more convenient business access to the mainland (56.9%).
This study also tracked the pace of recovery for transshipments between the mainland and overseas locations that are routed through Hong Kong following the normalisation of land‑based cross‑boundary transportation.
Among those who re‑export goods through Hong Kong, 36.5% anticipated to increase shipments via the city, while 43.9% predicted shipments would stay the same and 19.6% expected a decline in 2023.
For traders planning to increase transshipments through Hong Kong, end‑user requests (50.9%) were the primary reason, followed by the city’s storage, sub‑packaging and processing services (43.9%), its efficient customs (34.2%), its comprehensive logistics services (33.3%), and overseas transport networks (31.6%).
For those who planned to decrease transshipments through Hong Kong, end‑user requests (45.9%) were also the key reason, followed by a preference for ports nearer production bases (37.7%) and the mainland’s improving logistics and transport networks (24.6%).
| Major reasons for increase | Major reasons for decrease |
| 1. End-user requests (50.9%) | 1. End-user requests (45.9%) |
| 2. Needs for storage, sub-packaging, processing within Hong Kong (43.9%) | 2. Prefer ports nearer to place of production (37.7%) |
| 3. Efficient customs and declaration procedures (34.2%) | 3. Improved logistics and transport network on the mainland (24.6%) |
| 4. Efficient and comprehensive logistics services (33.3%) | (n=61) |
| 5. Full coverage of logistics and transport network (31.6%) | |
| (n=114) |
In terms of production and operating costs, a majority of Hong Kong exporters (55.7%) expect costs to increase in 2023, while 36.6% anticipate steady costs and 7.7% foresee costs falling.
Among those who see costs rising in 2023, higher costs for raw materials (81.6%), logistics (61.5%), and labour (52.3%) were the main concerns.
| Costs raising factors |
| 1. Increase in raw material prices (81.6%) |
| 2. Increase in logistics costs (61.5%) |
| 3. Increase in labour costs (52.3%) |
| (n=283) |
In 1Q23, Hong Kong exporters focused more on cash‑flow management (39.9%, up 5.3 percentage points), e‑commerce efforts (36.3%, up 7.5 percentage points), expanding value‑added services (31.6%, up 6.6 percentage points), and diversifying new overseas markets (30.5%, up 7.5 percentage points).
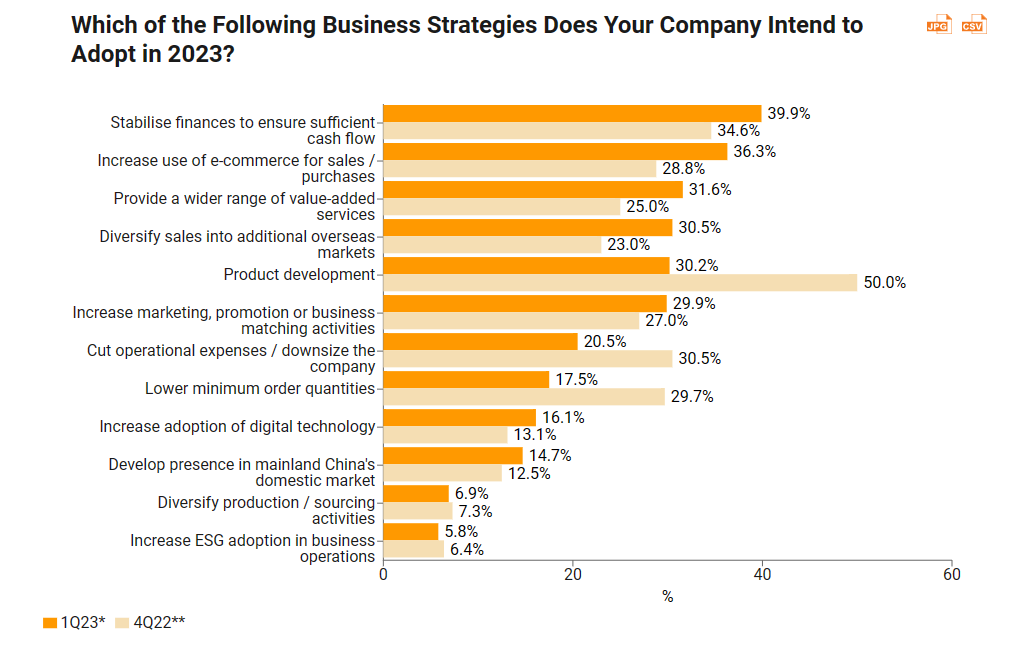
Note: Respondents could select all options that applied.
* Based on 1Q23 survey (Base: Number of respondents with a valid response, n=361)
** Based on 4Q22 survey (Base: Number of respondents with a valid response, n=344)


























First, please LoginComment After ~