ASEAN Market Snapshot: Thailand
Thailand is the second largest economy in ASEAN, with a GDP of US$495 billion[1] and a population of about 71.6 million[2] in 2022, where substantial progress in social and economic development has led to steadily increasing household incomes in recent decades. According to United Nations projections[3], Thailand’s urban population reached 53% of its total population in 2022, compared to 45% in 2012, giving rise to a dynamic and growing consumer market, supported by a fast‑growing middle class, which has been quickly adapting to new digital and lifestyle trends and generating new demand for goods and services.
For more information on Thailand’s economy and trade and investment relationship Hong Kong, please visit the Thailand Market Profile.
Consumer profile
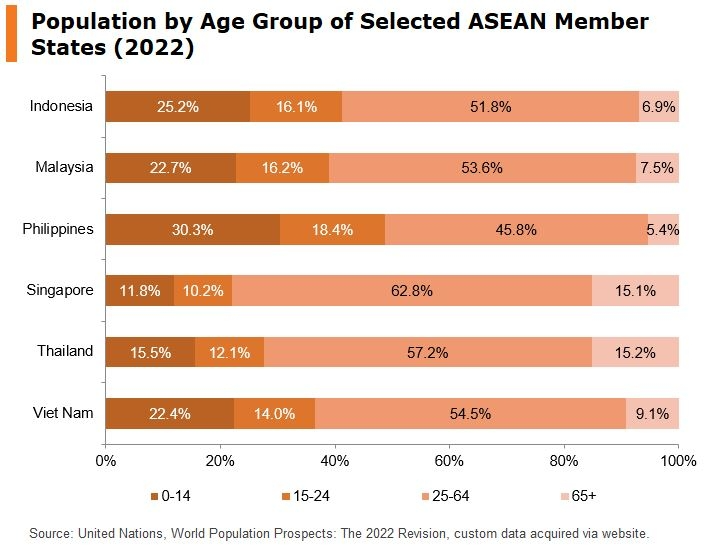
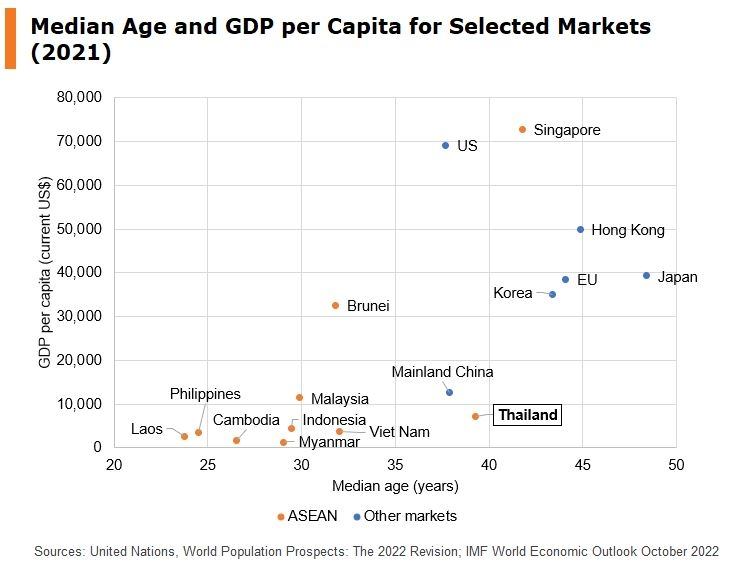
Based on the United Nations database, the Thai population had a median age of 39.3 in 2021, compared to the ASEAN median of 30.3, making it the second highest in the trade bloc after Singapore (41.8). As for purchasing power, Thailand – an upper‑middle income country – was ranked fourth in ASEAN in terms of GDP per capita, behind only the high‑income economies of Singapore and Brunei and Malaysia, which the World Bank expects to reach high‑income status by 2028.[4]
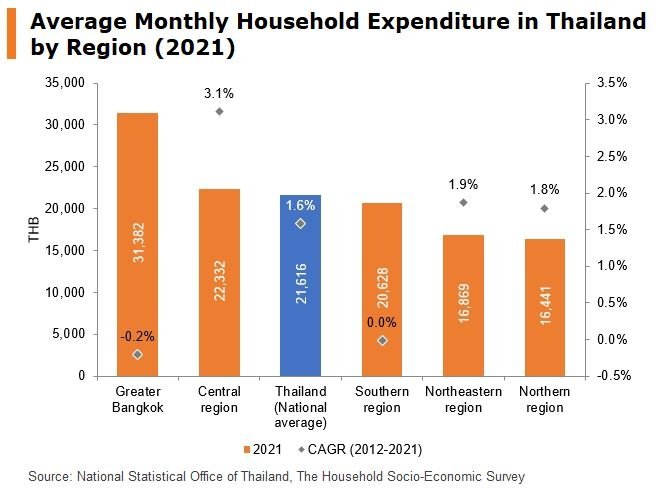
On average, Thai households earned THB27,352 and spent THB21,616 each month in 2021, exceeding average monthly household incomes and expenditures in pre‑pandemic 2019 by 5.1% and 4.2% respectively, according to the National Statistics Office of Thailand.[5] Levels of expenditure, however, vary considerably across different regions.
Bangkok, the capital of Thailand, is the country’s most populous city, with a population of 5.5 million in 2021. Centred around the capital city, the Greater Bangkok region had the highest average monthly household expenditure (THB31,382) among the five major regions of Thailand. Average expenditure in Greater Bangkok, however, has remained stagnant over the past decade, registering a ‑0.2% compound annual growth rate (CAGR) between 2012 and 2021, lagging behind the national average of 1.6%. In that period, the Central region – which includes popular tourist destinations such as Chonburi and Kanchanaburi – led the country at 3.1% CAGR for average expenditure growth, followed by the Northeastern (1.9%) and Northern (1.8%) regions.
In terms of product categories, the average Thai household spends the most on food and non‑alcoholic beverages (33.7% of monthly expenditure), followed by housing and household operation (21.4%), which includes items such as rent, utilities, furniture, and household appliances; transport and communication (20.0%); and non‑consumption expenditures (13.0%), such as taxes, gifts, contributions and insurance.
Again, some regional differences in spending patterns exist. Households in the higher‑income and more urbanised Greater Bangkok area, for instance, tends to allocate a smaller proportion of their expenditure to essential goods, such as food and beverage, and a larger proportion on housing, education and healthcare, compared to the national average.
Average monthly household expenditure by item for selected regions (2021)
Expenditure item | Thailand average | Greater Bangkok | Central region | |||
Value (THB) | Share (%) | Value (THB) | Share (%) | Value (THB) | Share (%) | |
Food and non-alcoholic beverages | 7,281 | 33.7 | 9,668 | 30.8 | 7,398 | 33.1 |
Housing and household operation | 4,632 | 21.4 | 7,674 | 24.4 | 4,457 | 19.9 |
Transport and communication | 4,327 | 20.0 | 6,075 | 19.4 | 4,794 | 21.5 |
Non-consumption expenditure | 2,814 | 13.0 | 4,292 | 13.7 | 3,081 | 13.8 |
Personal care | 701 | 3.2 | 975 | 3.1 | 708 | 3.2 |
Medical and healthcare | 364 | 1.7 | 707 | 2.2 | 335 | 1.5 |
Apparel and footwear | 359 | 1.7 | 461 | 1.5 | 363 | 1.6 |
Education | 337 | 1.6 | 750 | 2.4 | 247 | 1.1 |
Alcoholic beverages | 251 | 1.2 | 277 | 0.9 | 328 | 1.5 |
Recreational and special ceremony expenses | 226 | 1.0 | 154 | 0.5 | 215 | 1.0 |
Religious activities | 196 | 0.9 | 211 | 0.7 | 222 | 1.0 |
Tobacco products | 127 | 0.6 | 139 | 0.4 | 184 | 0.8 |
Source: National Statistical Office of Thailand, The 2021 Household Socio‑Economic Survey.
Post-pandemic omni-channel retail
Physical retail
In step with its post‑Covid re‑opening policy, Thailand’s overall community mobility for retail activities, as measured by Google’s metrics,[6] had largely returned to pre‑pandemic levels in 2022. This has paved way for the recovery of Thailand’s physical retail market, with shopping centres and malls being a staple of the Thai consumer’s shopping experience. Prior to the pandemic, an HKTDC survey found that 70% of Bangkok consumers regularly visited shopping centres at least once a month, while 16% visited once or more per week.[7]
Tourism was another major driver of the Thai retail economy before the pandemic. In 2019, travel accounted for US$59.8 billion (73.7% share) of the country’s total service exports in 2019. Thailand was the most popular tourist destination in ASEAN, receiving 39.9 million tourist visits in 2019, among which China (27.6% share) was the top source of visits.[8] As global travel continues to normalise, especially following China’s resumption of overseas travel, tourism is expected to boost retail spending in Thailand and provide momentum for its post‑pandemic economic recovery. The Thai finance ministry has forecast 27.5 million foreign tourist arrivals for 2023.[9]
E-commerce
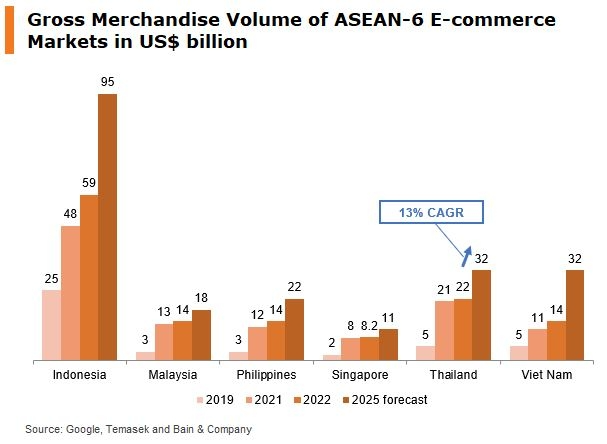
According to a 2022 report by Google, Temasek and Bain & Company,[10] Thailand is currently the second largest e‑commerce market in Southeast Asia, with a total gross merchandise value (GMV) of US$22 billion. While the growth of online retail has decelerated due to the resumption of in‑person activities post‑pandemic, the Thai e‑commerce market is expected to maintain a solid CAGR of 13% through to 2025, reaching a GMV of US$32 billion. Another report by media companies We Are Social and Meltwater[11] estimated that, by value, 65.9% of e‑commerce purchases for consumer goods were made on mobile phones in 2022.
The Thai e‑commerce market features an intensely competitive environment for e‑commerce platforms, with options ranging from regional marketplaces Shopee and Lazada to local platforms such as JD Central, HomePro and retailer websites. A Meta and Bain survey[12] found that Thai consumers used an average of 16.4 online platforms for online shopping (including food delivery) in 2022, the highest among Southeast Asian countries and nearly double the number in 2021. Value for money is the focus of attention for the Thai e‑commerce market, with “better value” and “better prices” being the top reasons for consumers to switch brands and platforms respectively, followed by better products.
E-commerce consumers in Thailand
Top three reasons to switch brands | Top three reasons to switch platforms | |||
1 | Better value | 1 | Better prices | |
2 | Better product | 2 | Better product quality | |
3 | Bored of current brand | 3 | Faster delivery time | |
Source: Meta and Bain
The marked rise in user penetration for e‑commerce also contributed to an increase in demand for more convenient delivery options. Results from a 2022 Visa survey[13] showed that Thailand had the highest usage rate for home delivery among Southeast Asian countries, with consumers using home delivery for an average of 7.8 out of 10 purchases, compared to the Southeast Asian average of 7.2. Both of these figures were significantly higher than the pre‑pandemic 3.9 for Thailand and 3.4 for Southeast Asia. Up to 96% of the surveyed Thai consumers used home delivery at least once in 2021.
Digital engagement
Thailand has an estimated 52.3 million active social media user accounts (equivalent to 73% of the population).[14] Meta and Bain’s 2022 survey[15] found that online engagement, particularly via social media and messaging, was the top source of influence on consumer considerations for products and brands in Southeast Asia. The most influential source of information for Thai consumers was online word‑of‑mouth, followed by influencer ads on video platforms and social media ads.
Digital payments
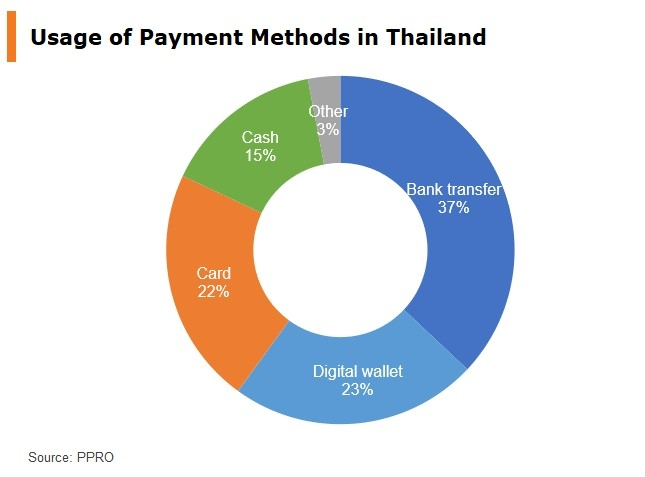
Consumers in Thailand have shown an increasing preference for digital payments over cash in recent years. Visa’s 2022 survey[16] found that 94% of consumers in Thailand had used cashless payments in the past, and 89% planned to use them more often. Digital banking services are also common, with 96% of the surveyed Thai consumers had a mobile banking app installed on their phones. According to digital payments infrastructure provider PPRO[17], bank transfers was the most popular payment method in Thailand with 37% share. PromptPay, a government‑backed real‑time proxy payment system, is commonly used among both consumers and businesses across Thailand for fund transfers. In 2022 alone, about 14.8 billion transactions were made through PromptPay, totalling THB43.2 trillion (US$1.2 trillion) in value.[18]
Central banks in ASEAN have also stepped up their efforts to enhance payment connectivity in the region. Thailand had already launched cross‑border QR payment linkages with Cambodia, Indonesia, Malaysia, Singapore and Viet Nam, allowing real‑time payments to be made and settled in local currencies across borders.
[1] Office of the National Economic and Social Development Council, Thailand, Thai Economic Performance in Q4 of 2022 and the Outlook for 2023.
[2] United Nations, Department of Economic and Social Affairs, Population Division (2022). World Population Prospects: The 2022 Revision, custom data acquired via website.
[3] United Nations, Department of Economic and Social Affairs, Population Division (2018). World Urbanization Prospects: The 2018 Revision, custom data acquired via website.
[4] The World Bank, Malaysia to Achieve High Income Status Between 2024 and 2028, but Needs to Improve the Quality, Inclusiveness, and Sustainability of Economic Growth to Remain Competitive, 16 March 2021.
[5] National Statistical Office of Thailand, The 2021 Household Socio-Economic Survey.
[6] Google, COVID-19 Community Mobility Report: Thailand, 15 October 2022.
[7] HKTDC Research, Shopping in Thailand: Bangkok Consumer Characteristics.
[8] ASEAN Secretariat, ASEAN Statistical Yearbook 2022.
[9] National News Bureau of Thailand, Finance Ministry Maintains 2023 GDP Growth Outlook, 28 Jan 2023.
[10] Google, Temasek and Bain & Co., e-Conomy SEA 2022.
[11] We Are Social and Meltwater, Digital 2023 Thailand, 13 February 2023.
[12] Meta and Bain & Company, Southeast Asia’s Digital Consumers: A New Stage of Evolution, September 2022.
[13] Visa, Consumer Payment Attitudes Study 2022. The study covers seven Southeast Asian countries, namely: Singapore, Malaysia, Thailand, Indonesia, the Philippines, Vietnam, and Cambodia.
[14] We Are Social and Meltwater, Digital 2023 Thailand. Social media users may not represent unique individuals.
[15] Meta and Bain & Company, Southeast Asia’s Digital Consumers: A New Stage of Evolution.
[16] Visa, Consumer Payment Attitudes Study 2022.
[17] PPRO, Discover online payments and e-commerce in Thailand, accessed 3 March 2023.
[18] Bank of Thailand, Statistics: Use of PromptPay. Provisional data as of 31 March 2023.












First, please LoginComment After ~