The Slope of the Phillips Curve for Service Prices in Japan: Regional Panel Data Approach
Download → Full Text [PDF 451KB]
Abstract
We estimate the slope of the Phillips curve for service prices in Japan using prefecture-level panel data, where we control the impact of inflation expectations on inflation by including time-fixed effects instead of proxies for inflation expectations. Our estimates indicate the flattening of the slope of the Phillips curve for the majority of seven subgroups in services since the 2000s. We also examine for any changes in the slope of the Phillips curve in the 2010s and during the Covid-19 pandemic, but observe no clear evidence of such changes.
JEL Classification
C32, C33, E31, E52
1. Introduction
Understanding the mechanism of inflation dynamics is crucial for central banks seeking price stability. The Phillips curve is the traditional analytical framework used to analyze inflation dynamics by academics and policymakers (Hara et al. 2020). In particular, the New Keynesian Phillips curve (NKPC), with its micro-foundations of nominal price rigidities, is the primary analytical framework in modern macroeconomics.
The framework of the NKPC categorizes the drivers of inflation dynamics into (1) supply-demand balance, (2) inflation expectations, and (3) other factors including supply shocks (Nishizaki et al. 2011). Various studies have suggested a weakening relationship between the supply-demand balance and inflation—seen in a flatter Phillips curve slope and less sensitive inflation to changes in supply-demand balance—since the 1990s, especially in major advanced economies (Hall 2011; IMF 2013; Del Negro et al. 2020). For example, Rusticelli et al. (2015) estimate the slope of the Phillips curve (coefficient for unemployment gap) for OECD economies and find that the post-1998 estimate is flatter or insignificant compared to the long-term estimate from the 1970s. Moreover, the IMF (2013) finds the flattening of the slope of the Phillips curve in many advanced countries since 1995 by using 6-10 year ahead inflation expectations from Consensus Forecasts in their estimation. Further, the literature considers that the mild disinflation during the global financial crisis ("Missing Disinflation") and the lack of inflation rise during the post-crisis economic recovery ("Missing Inflation") imply the flattening of the slope of the Phillips curve.
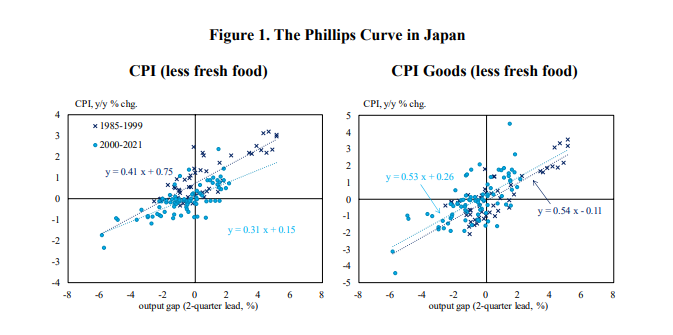
With respect to Japan, the flattening of the Phillips curve has been documented by many studies (Nishizaki and Watanabe 2000; De Veirman 2009; Nishizaki et al. 2011; Gemma et al. 2017; Kaihatsu and Nakajima 2018). For instance, Nishizaki and Watanabe (2000) show that the slope of the Phillips curve in Japan flattened significantly in the 1990s using prefecture-level data from 1971 to 1997. Further, Gemma et al. (2017) estimate the Generalized Phillips curve (the extended NKPC with time-varying trend inflation) in Japan and find the flattening of the slope of the Phillips curve during the low inflation period from 1998 to 2012. Importantly, visualizing the Phillips curve by plotting the Consumer Price Index (CPI) growth rate against the output gap in Japan reveals that the slope for goods has remained relatively unchanged throughout the sample period, whereas the slope for services has declined since 2000 (Figure 1). In this regard, Watanabe and Watanabe (2017) conduct an estimation of the Phillips curve using a rolling sample window approach from 1987 to 2013 and utilizing CPI data for both goods and services. Their results show that throughout the entire sample period, the slope of the Phillips curve for services was consistently flatter compared to the slope for goods, and the slope of the Phillips curve for both goods and services has flattened since the late 1990s. In addition to the findings of Watanabe and Watanabe (2017), the flattening of the Phillips curve for service prices has also been documented by other studies such as Saita et al. (2006) and Kaihatsu et al. (2022).
In the context of estimating the slope of the Phillips curve, one major challenge is to account for factors that may affect the inflation rate as well as the output gap, such as inflation expectations. According to the literature, there are two standard approaches employed to control the impact of inflation expectations on the inflation rate in estimating the slope of the Phillips curve: (1) actual inflation rate is utilized as a proxy variable for inflation expectations, based on the assumption of "full-information rational expectation formation" (Galí and Gertler 1999) and (2) inflation expectations gathered from survey research for each economic agent are utilized (Roberts 1995). Because the assumptions about the process of inflation expectations are different, these two approaches could generate significantly different estimation results (Mavroeidis et al. 2014). In terms of the recent developments in the literature, the use of survey data on inflation expectations has gained increasing popularity in recent years, reflecting a growing recognition that expectation formation by economic agents is not consistent with "full-information rational expectation formation" (Coibion and Gorodnichenko 2015a, 2015b; Fuhrer 2012, 2017; among others). However, the survey data collected from different types of economic agents, such as households and firms, is influenced by unique noise that causes variations in the level and movement of data from one type of agent to another. This poses another challenge in estimating the Phillips curve. Neglecting this issue can lead to biased parameters and reduced reliability of the estimation results.





















First, please LoginComment After ~