HKEX QUARTERLY RESULTS FOR THE NINE MONTHS ENDED 30 SEPTEMBER 2023
HIGHLIGHTS
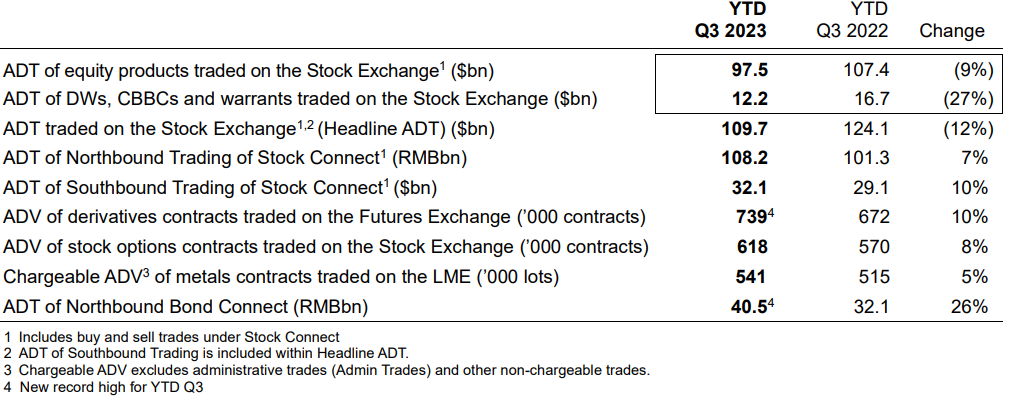
▪ ADV of derivatives contracts traded on HKFE, Bond Connect Northbound ADT and ADT of ETPs all reached record nine-month highs
▪ OTC Clear’s total clearing volume in Q3 2023 reached a record quarterly high
▪ Launch of HKEX Synapse on 9 October 2023, a new smart contract-powered platform, accelerating the settlement process for Stock Connect Northbound Trading
▪ Confirmed launch for FINI, Hong Kong's new digitalised IPO settlement platform
▪ Consultation paper on GEM Listing Reforms published
▪ Introduction of block trading under Stock Connect announced
▪ The LME Group announced two key initiatives under its two-year Action Plan: extending the use of volume-weighted average prices to determine Closing Prices in its most liquid contracts; and the approval of the first fast track brand registration for nickel
Comparison of Q3 2023 with Q3 2022
Financial Highlights
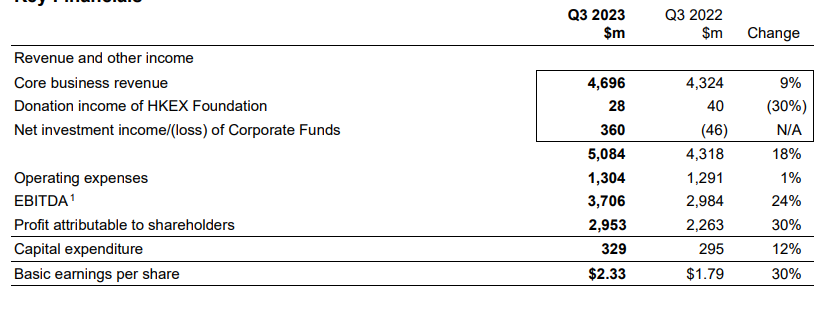
▪ Q3 2023 revenue and other income of $5,084 million, up 18 per cent compared with Q3 2022 - Core business revenue up 9 per cent against Q3 2022, attributable to the increase in net investment income from Margin Funds and Clearing House Funds, partly offset by lower listing fees - Net investment income from Corporate Funds of $360 million, compared to a Q3 2022 loss of $46 million, driven by higher investment income from internally-managed Corporate Funds, and lower fair value losses on the externally-managed investment funds (External Portfolio) of $5 million (Q3 2022: losses of $148 million)
▪ Operating expenses up 1 per cent, attributable to higher staff costs and IT costs, partly offset by lower charitable donations and professional fees
▪ EBITDA margin1 of 74 per cent, 4 percentage points higher than Q3 2022
▪ Profit attributable to shareholders of $2,953 million, 30 per cent higher than Q3 2022
Key Financials
Key Market Statistics

Comparison of YTD Q3 2023 with YTD Q2 2022
Financial Highlights
▪ Second best ever nine-month revenue and other income and profit in YTD Q3 2023, after exceptional YTD Q3 2021
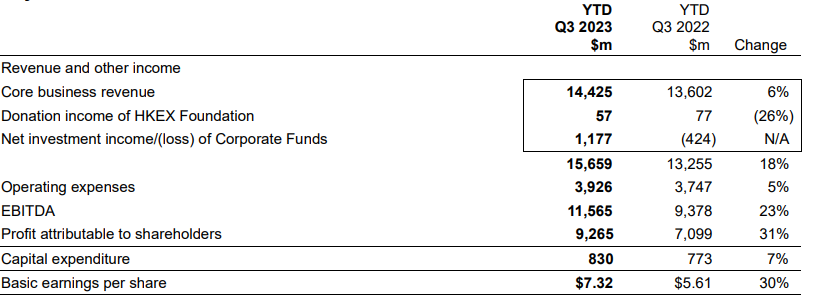
▪ YTD Q3 2023 revenue and other income of $15,659 million, 18 per cent higher than YTD Q3 2022
- Core business revenue up 6 per cent, due to higher net investment income from Margin Funds and Clearing House Funds; and record nine-month derivatives contract ADV in YTD Q3 2023. Increase partly offset by lower trading and clearing fees from lower Headline ADT and lower listing fees - Net investment income from Corporate Funds of $1,177 million (YTD Q3 2022: loss of $424 million), driven by net fair value gains on the External Portfolio of $210 million (YTD Q3 2022: losses of $659 million) and higher investment income from internally-managed Corporate Funds
▪ Operating expenses up 5 per cent against YTD Q3 2022, attributable to higher staff costs, IT costs, and professional fees, partly offset by lower charitable donations
▪ EBITDA margin of 75 per cent, 4 percentage points higher than YTD Q3 2022
▪ Profit attributable to shareholders was $9,265 million, 31 per cent higher than YTD Q3 2022
Key Financials
Key Market Statistics














First, please LoginComment After ~