ASEAN Ascends – An Overview of Investment Opportunities in Vietnam (Part One)
Vietnam is the fourth largest economy in ASEAN and enjoys one of the highest growth rates in the bloc. Its economic success, coupled to factors such as its stability and its large young population, have long made it a popular place for companies in Hong Kong and the Greater Bay Area (GBA) looking to expand their overseas production lines. This has become particularly evident with the implementation of the “China + 1” strategy in recent years.
According to Navigating Connectivity: Exploring ASEAN Opportunities for the Greater Bay Area, a survey jointly conducted by HKTDC and United Overseas Bank Hong Kong, Vietnam is the ASEAN country that offers the most potential as a production or procurement base for GBA enterprises, both now and over the next three years. HKTDC Research has recently conducted a study of Hanoi, Haiphong, Ho Chi Minh City and Bình Dương in Vietnam, to learn more about the latest investment opportunities there.
Hong Kong-Vietnam trade
Trade between Hong Kong and Vietnam is growing strongly, with bilateral trade volume increasing at an average rate of 9.6% over the last 10 years. In 2023, Vietnam was Hong Kong’s seventh largest trading partner, fifth most popular export destination and eighth biggest source of imports. Bilateral trade volume in 2023 reached US$31.5 bn (HK$246.4 bn), 2.5 times higher than in 2013. Of the 10 ASEAN countries, Vietnam is Hong Kong’s largest export destination and second largest trading partner after Singapore.
The Hong Kong‑Vietnam trade pattern fits well with Vietnam’s developmental positioning as a key processing, assembling and exporting centre for the electronics industry. Electronic products have long been the most important part of Hong Kong‑Vietnam trade. In 2023, a large proportion (47.1%) of Hong Kong’s exports to Vietnam were semiconductor devices, alongside electronic products such as electric apparatus (7.3%) and telecommunications equipment (7.0%). Hong Kong’s imports from Vietnam were also dominated by semiconductor devices (46.3%), followed by telecommunications equipment (22.2%) and machinery parts (7.0%).
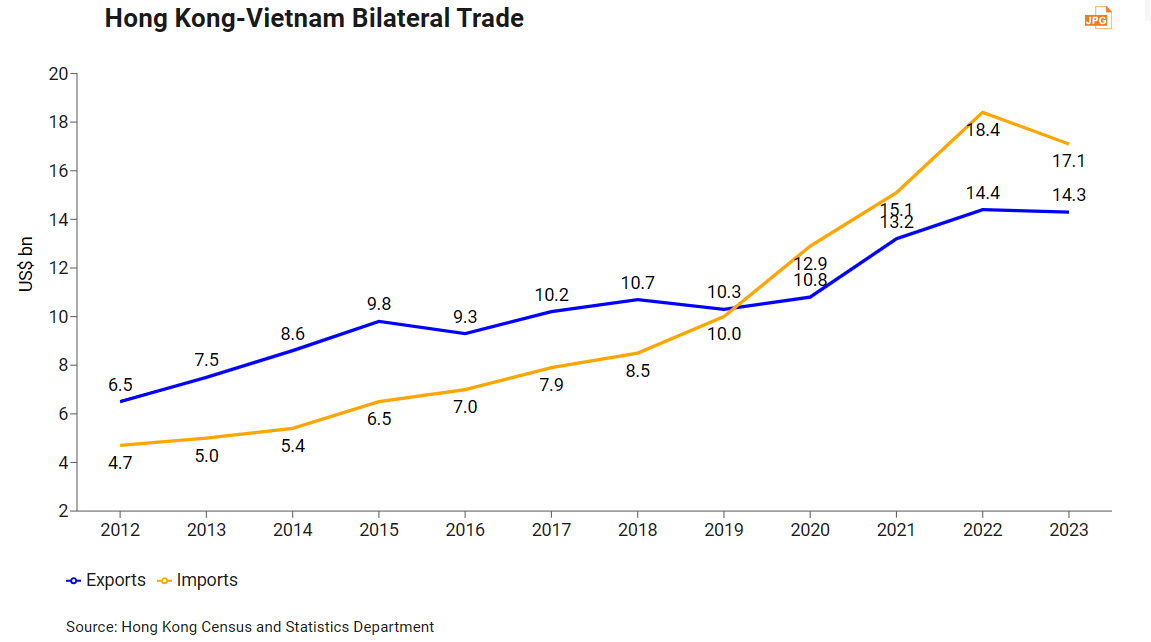
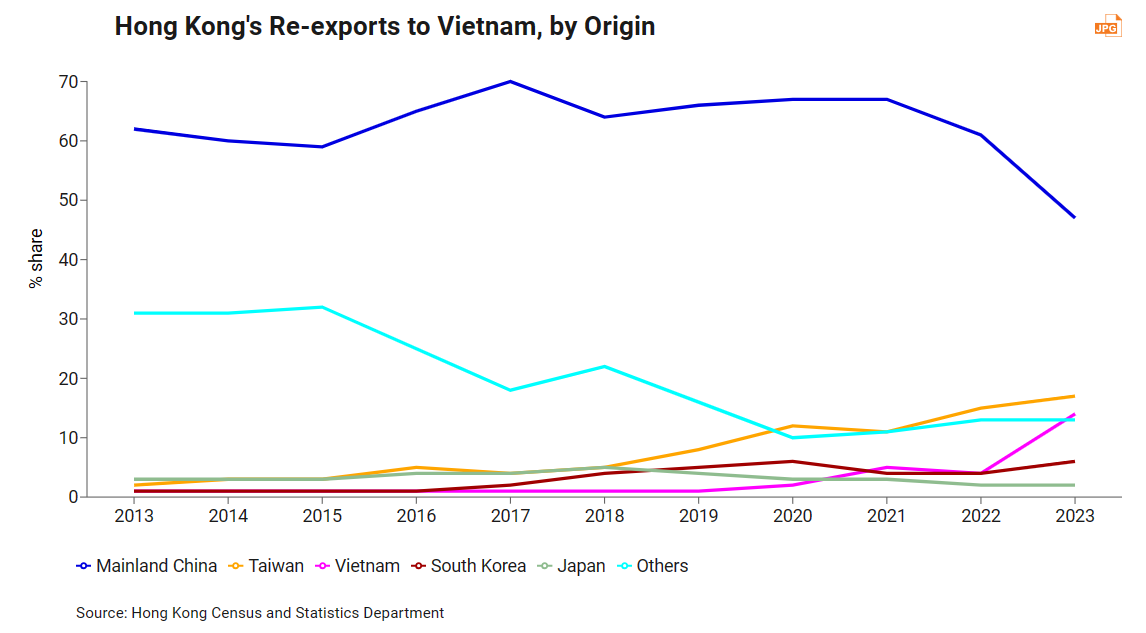
The Hong Kong‑Vietnam trade figures show that Hong Kong’s position as a key regional trade hub makes it an important transit point for Vietnam’s imports from Northeast Asia. In 2023, 72% of the value of goods re‑exported to Vietnam via Hong Kong came from the mainland China (47%), Taiwan (17%), South Korea (6%) and Japan (2%). This dovetails with the trade structure which derives from Vietnam’s thriving processing and manufacturing industries.
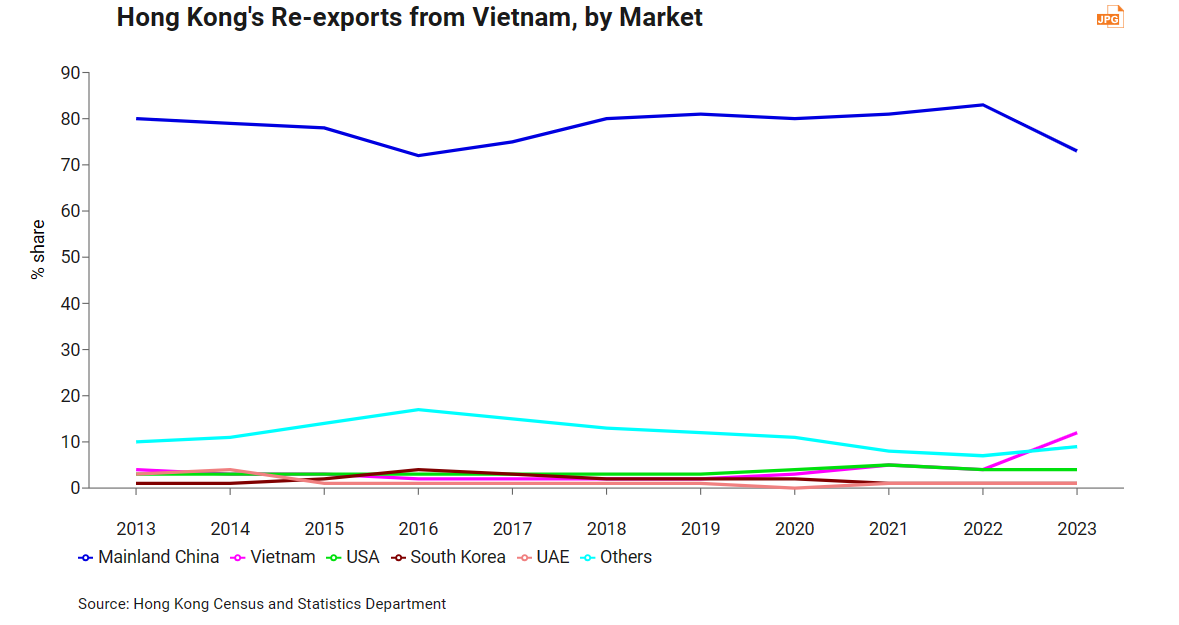
The great majority of goods imported into Hong Kong from Vietnam are re‑exported to the mainland. These re‑exports account for 70% of the value of Hong Kong’s imports from Vietnam, or 20% of the total value of goods exported from Vietnam to the mainland. In fact, many goods exported from Vietnam (especially from northern Vietnam) are shipped first to Hong Kong before being re‑exported to the mainland or other parts of the world, a factor which has made Hong Kong Vietnam’s fifth largest export destination1. With an increasing number of mainland enterprises setting up factories in Vietnam to carry out export processing, and given Hong Kong’s geographic advantage of being close to northern Vietnam, Hong Kong’s logistics industry should take a greater interest in taking advantage of the opportunities available in re‑exporting Vietnamese goods.
In recent years, the proportion of Vietnamese goods re‑exported back to Vietnam via Hong Kong has repeatedly hit new highs. This is a testament to Hong Kong’s role and advantage as a regional logistics and distribution centre.
Vietnamese economic development
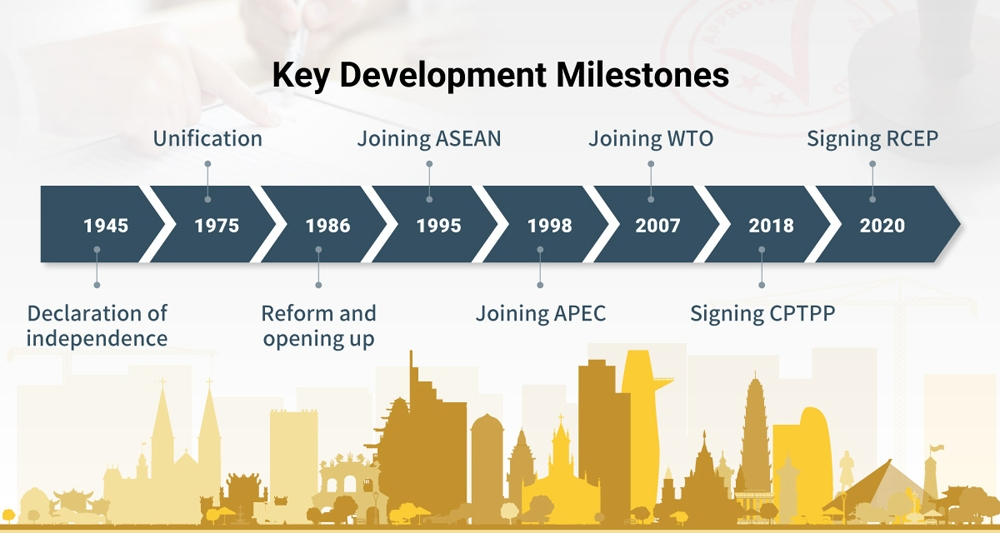
Vietnam has developed rapidly since implementing economic reforms in 1986. Over the last 30 years, it has maintained high levels of economic growth, so much so that the average annual compound growth rate of its GDP is over 6%. In 2023, its per capita GDP was 13 times higher than before reform and opening up.
Even so, income levels in Vietnam are still low compared with those in other major ASEAN economies. In 2023, Vietnam’s per capita GDP was a mere US$4,316, lower than Singapore (US$87,884), Malaysia (US$13,034), Thailand (US$7,298) and even Indonesia (US$5,109).
Since joining the World Trade Organisation (WTO) in 2007, Vietnam has actively negotiated free trade agreements (FTAs) with other countries. To date, it has signed 16 FTAs, including the Regional Comprehensive Economic Partnership (RCEP) free trade agreement, the Comprehensive and Progressive Agreement for Trans-Pacific Partnership (CPTPP), the Vietnam-European Union Free Trade Agreement, and the Vietnam-Eurasian Economic Union Free Trade Agreement. These agreements cover most of Vietnam’s major trading partners.
|
Vietnam Free Trade Agreements |
Year of Signature |
|
ASEAN-FTA |
1995 |
|
ASEAN-China FTA |
2003 |
|
ASEAN-South Korea FTA |
2007 |
|
ASEAN-Japan CEP |
2008 |
|
Vietnam-Japan EPA |
2009 |
|
ASEAN-India FTA |
2010 |
|
ASEAN-Australia-New Zealand FTA |
2010 |
|
Vietnam-Chile FTA |
2014 |
|
Vietnam-South Korea FTA |
2015 |
|
Vietnam-EAEU FTA |
2016 |
|
CPTPP |
2018 |
|
ASEAN-Hong Kong FTA |
2019 |
|
Vietnam-EU FTA |
2020 |
|
Vietnam-UK FTA |
2021 |
|
RCEP |
2022 |
|
Vietnam-Israel FTA |
2023 |
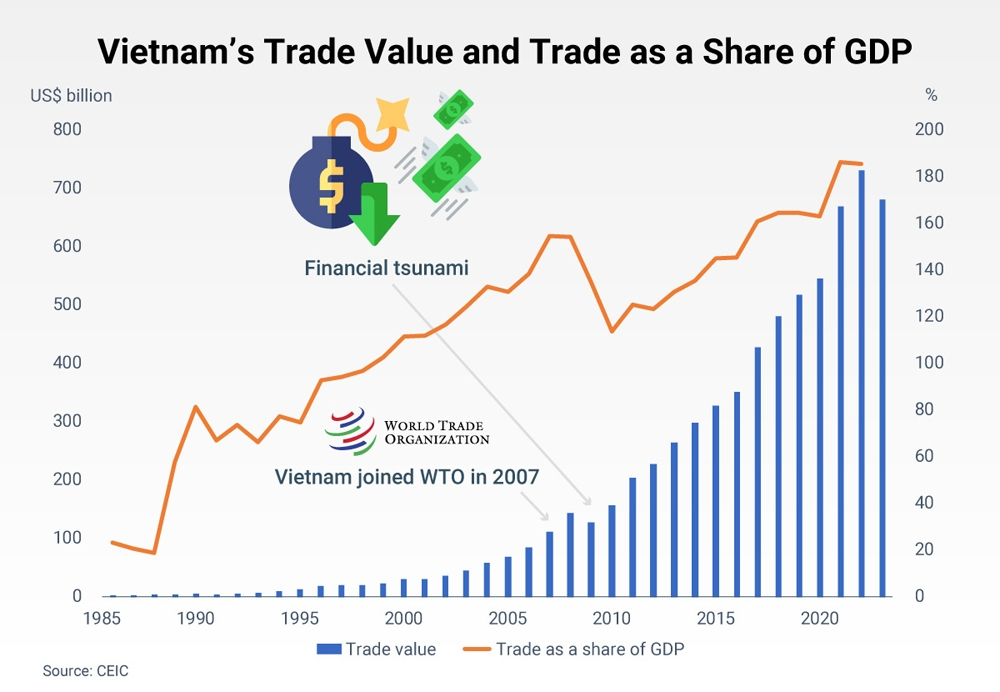
Since the economic reforms and opening up of 1986, Vietnam has taken steps to actively integrate itself into the global trading system. As a result, the contribution of trade to the country’s economic development has become increasingly vital. In 1986, trade was equivalent to just 20% of Vietnam’s GDP. By the time it joined the WTO in 2007, that percentage had increased to over 150% and its total trade (imports and exports) value was worth US$111.3 bn – 38 times higher than the value in 1986. Hit hard by the financial tsunami in 2008, Vietnam’s trade growth temporarily came to a halt, but soon resumed its rising track and reached its highest level in 2022. The country’s trade value in 2022 was 6.5 times that of 2007, and its share of GDP had risen to 186%, a figure bettered by only 12 other countries in the world.
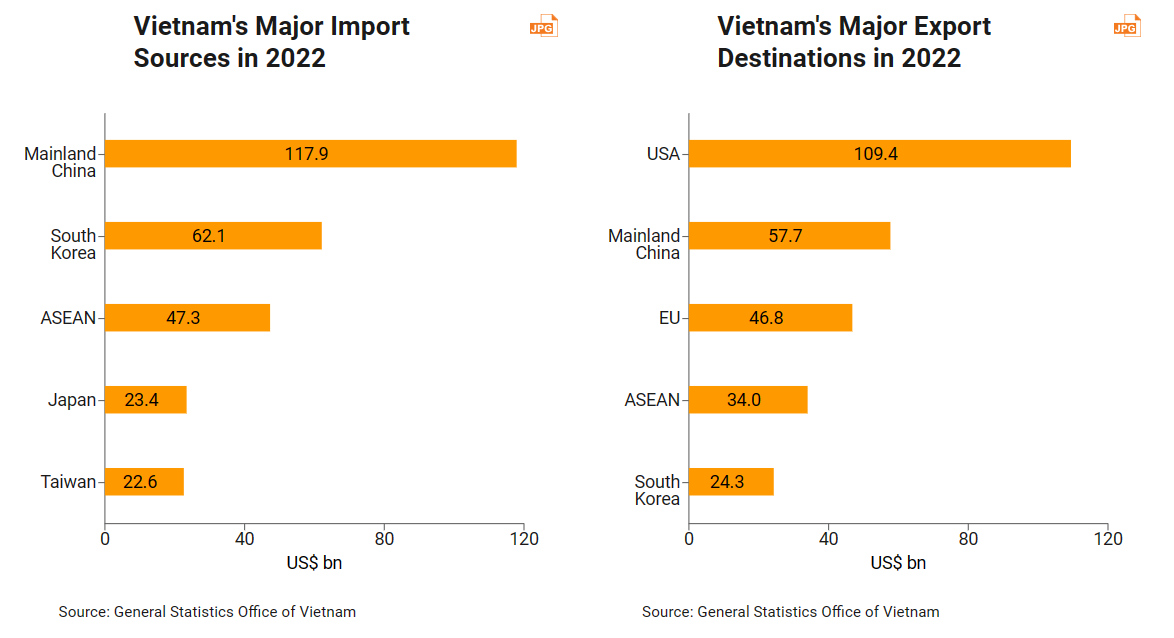
According to Vietnam’s official statistics, the value of the country’s imports in 2022 was US$358.9 bn and the value of its exports was US$371.3 bn. The main sources of its imports were mainland China, South Korea, ASEAN, Japan and Taiwan; while the US, mainland China, the EU, ASEAN and South Korea were its main export destinations. This indicates that Vietnam’s trade structure is importing parts and components from Northeast Asia for processing or assembly, and exporting the finished products to American and European markets.
The pattern of Vietnam’s sources of imports shows that it is an ideal partner for the “China + 1” strategy. Vietnam offers diversified supply chain options: it can cater to customer needs by procuring parts and components from anywhere in the region for processing or assembly.
Foreign capital
Apart from Singapore and Indonesia, Vietnam is the ASEAN country most capable of attracting foreign capital. Vietnam is an export‑oriented economy, with exports as the main engine driving the country’s economic development, and foreign capital as the main enabler of its export activities. According to Vietnam’s official figures, foreign capital contributed nearly US$260 bn in export revenue in 2023, 73.1% of the country’s total. In some industries, the vast majority of related export income was generated by foreign‑funded enterprises – industries such as telephones (99.6%), computers (98%), machinery (93%) and garments and textiles (60+%).
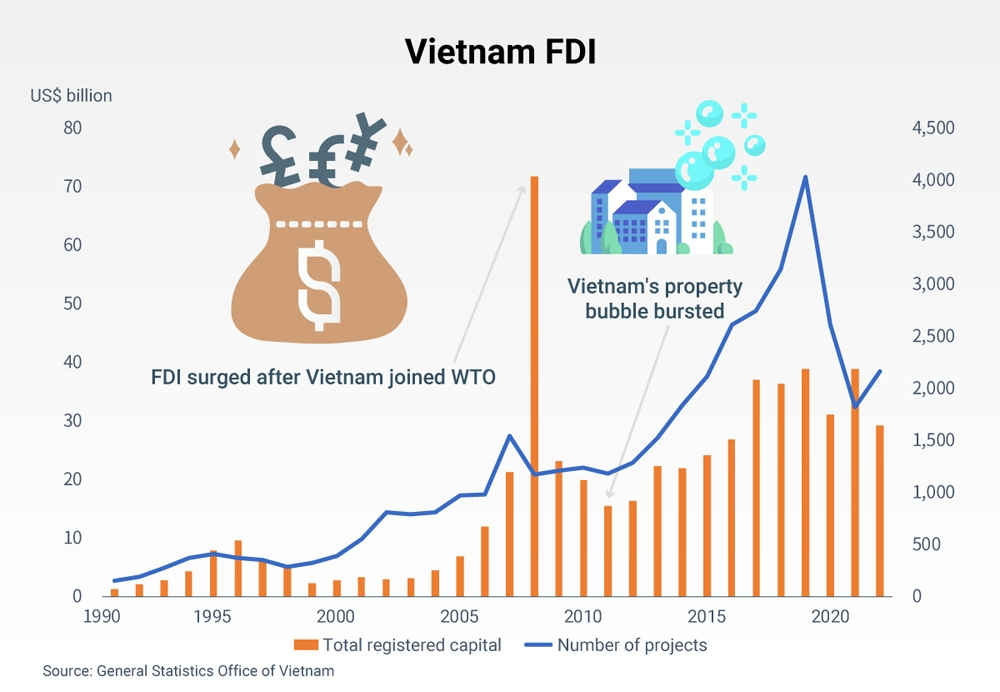
Since economic reform and opening up, and particularly so in the last 10 years, there has been a basic upward trend of foreign capital flowing into the country. As of 2022, the cumulative amount of registered foreign capital in Vietnam had reached US$441 bn, spread over 36,345 projects.
South Korea, Singapore, Japan, Taiwan, Hong Kong and mainland China are the six main sources of foreign capital, accounting for 70% of the total amount between them. South Korea is far ahead of the pack, contributing almost one‑fifth of the total foreign registered capital and being responsible for a quarter of all investment projects, followed by Singapore and Japan. South Korea’s Samsung and LG have already made substantial investments in Vietnam, while the residential projects of Japan’s AEON and Singapore’s CapitaLand can be seen across the country. It is true that most of the investment from Singapore, Hong Kong and the British Virgin Islands (the seventh largest source of foreign capital) is not necessarily being made by businesses in these countries and territories, but it is clear that Northeast Asia (South Korea, Japan, Taiwan and the mainland) has been a major source of investment in Vietnam for many years.
Investment by mainland Chinese enterprises in Vietnam has been increasing rapidly in recent years. According to data from the National Bureau of Statistics of China, the investment flow from the mainland to Vietnam exceeded US$2 bn in 2021, 6.6 times higher than in 2014. South Korea, Singapore and Japan are still Vietnam’s top investors. In 2022, these three countries invested US$16.7 bn in Vietnam, accounting for 57% of the total foreign registered capital that year. Mainland China (which provided US$2.6 bn in capital) surpassed Hong Kong (US$2.3 bn) and Taiwan (US$1.4 bn) to become the fourth largest source of foreign capital.
In Vietnam, foreign companies invest mainly in manufacturing, followed by real estate and energy supply. In terms of geographical distribution, they invest mainly in the south. Most of the top five provinces or cities in which foreign enterprises have a presence are in the south, with the exception of the northern region headed by Hanoi (other major cities include Haiphong and Bắc Ninh). Since development in the south is more saturated than in the north, Hong Kong companies intending on investing and establishing factories in Vietnam will find that costs in northern Vietnam are lower than in the south. Moreover, they will find that there is more room and greater flexibility in the supply of key factors of production, such as logistics services, labour, land and electricity.
It should be noted that the average registered capital2 of mainland investors – at an average of just US$6.5 mn – is lower than that of investors from other key countries. This may indicate that mainland investors prefer investment projects that require less capital.
|
Source of Foreign Capital | ||||
|
|
2022 |
Cumulative Foreign Capital | ||
|
Registered capital (US$ bn) |
No. of projects |
Registered capital (US$ bn) |
No. of projects | |
|
South Korea |
5.1 |
435 |
81 |
9,543 |
|
Singapore |
6.6 |
296 |
71 |
3,117 |
|
Japan |
5.0 |
225 |
69 |
4,987 |
|
Taiwan |
1.4 |
91 |
37 |
2,909 |
|
Hong Kong |
2.3 |
138 |
30 |
2,162 |
|
Mainland China |
2.6 |
296 |
23 |
3,571 |
|
Others |
6.3 |
688 |
129 |
10,056 |
|
Total |
29.3 |
2,169 |
441 |
36,345 |
|
Source: General Statistics Office of Vietnam | ||||
|
By Industry |
By Province/City | ||||
|
Industry |
Registered Capital |
Share |
Province/city |
Registered Capital |
Share |
|
Manufacturing |
261 |
59% |
Ho Chi Minh City |
56 |
13% |
|
Real Estate |
66 |
15% |
Bình Dương |
40 |
9% |
|
Electricity, fuel gas |
38 |
9% |
Hanoi |
39 |
9% |
|
Accommodation and catering services |
13 |
3% |
Ðồng Nai |
35 |
8% |
|
Construction |
11 |
2% |
Bà Ria-Vũng Tàu |
33 |
8% |
|
Wholesale, retail and trading |
10 |
2% |
Haiphong |
25 |
6% |
|
Transportation and warehousing |
6 |
1% |
Bắc Ninh |
23 |
5% |
|
Others |
34 |
8% |
Others |
188 |
43% |
|
Total |
441 |
100% |
Total |
441 |
100% |
|
Source: General Statistics Office of Vietnam | |||||
This article is published in two parts. To gain further insight into investment opportunities in Vietnam, please read ASEAN Ascends: An Overview of Investment Opportunities in Vietnam (Part Two).
1 ASEAN and the EU are not included as economic entities.
2 Registered capital divided by the number of projects.










First, please LoginComment After ~