HKTDC Export Confidence Index 2Q24: A Significant Upturn Amid Rising Optimism
The HKTDC Export Confidence Index 2Q 2024: Key Findings
·For 2Q24, the findings of the HKTDC Export Confidence Index indicate a significantly improved current performance, as well as a more optimistic business outlook overall. Reassuringly, all of this is underpinned by rising sales, new orders, higher prices and a likely increase in procurement activity.
oCrucially, the OverallCurrent Performance Index rose by 12 points to 51.6, while the Expectation Index finished even higher, at 54.3.
oDrilling down, Sales and New Orders were the most promising sub-indices. with both Current Performance (57.5, up 19.6 points) and Expectation (59.4, up 9.5 points) edging close to the relative high of 60.
oIn other positive signs, both the Current (at 54.0) and Expectation (at 57.2) readings of the ProcurementSub-Index exceeded the neutral 50 level, a clear sign of a likely upturn in procurement. In a similarly upbeat finding, exporters also reported higher-than-normal inventory levels in the expectation of rising sales and new orders.
oLess positively, though, the Cost Sub-Index remained in negative territory in the case of both its Current and Expectation readings, an indication that upward cost pressures are yet to abate.
Sub-Indices
·Significantly, exporters demonstrated an upbeat outlook with regard to all of their key markets. Optimism was highest in the case of mainland China, with both the Current and Expectation readings rising to above 60. The US, the EU and the ASEAN bloc were the next most well-regarded markets with Current and Expectation readings well above the 50 threshold level for all three.
·In terms of sectors, the most positively regarded was electronics, followed by jewellery and equipment / materials.
External and market issues
·For the most recent quarter, rising transport costs overtook an economic slowdown / recession as the primary concern of most exporters, while higher capital costs and exchange-rate fluctuations also remained issues for survey participants. On a more positive note, exporters saw the growth of e-commerce, the upturn in activity in many overseas markets and the wider deployment of AI / new technology as likely to provide fresh impetus for export-led businesses.
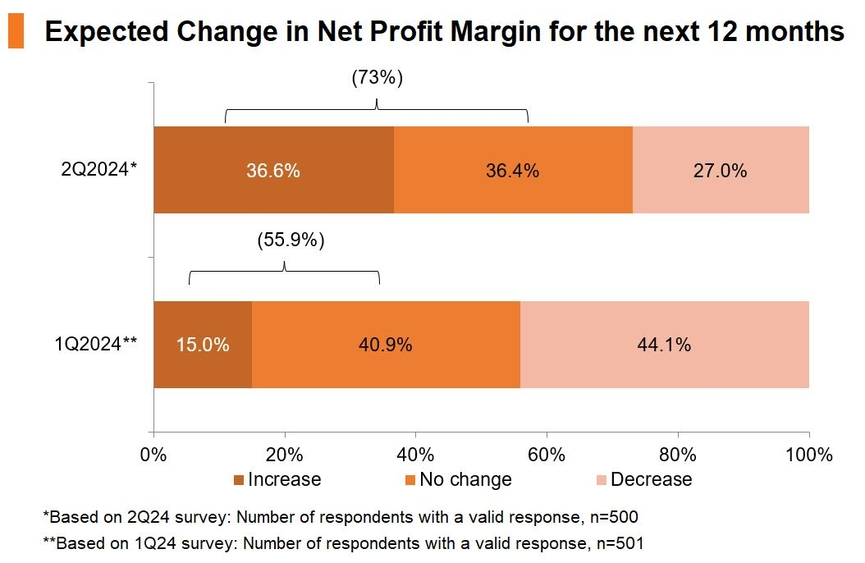
·In all, the vast majority of exporters (73.0%) expected higher (36.6%) or stable (36.4%) profit margins in the next 12 months, a significant increase on the figure recorded for 1Q24 (55.9%).
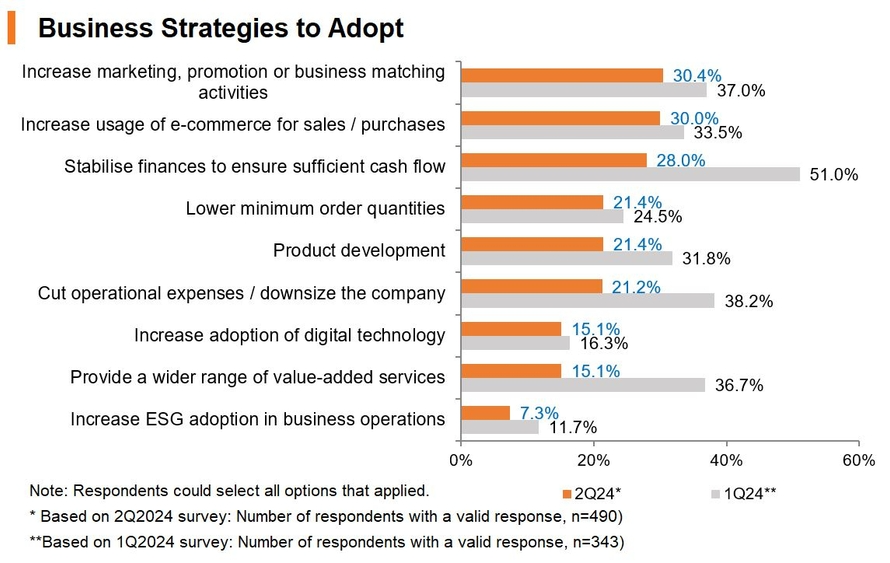
·It was also notable that many exporters appear to be abandoning their conservative approach to cash-flow management in favour of a more balanced strategy.
·Other strategies gaining popularity included more flexible arrangements with regard to sales and product development, as well as cuts in operational expenses.
Index overview
The new HKTDC Export Confidence Index, which debuted at the end of 1Q24, comprises five sub indices – (1) Sales and New Orders, (2) Trade Value, (3) Cost, (4) Procurement, and (5) Inventory. All of these are composited in order to deliver a comprehensive evaluation of the business prospects of Hong Kong exporters (see Appendix for more detailed methodology).
In 2Q24, the HKTDC Export Confidence Index’s overall Current Performance and Expectation score was above the watershed figure of 50, an indication of a strong rebound in export activity and of a more optimistic view of future prospects.
Tellingly, the Current Performance rose significantly, climbing up 12.0 points from 1Q to 51.6. The overall exporter Expectation level also stood at a reassuringly high level of 54.3, marking a clear indication of a likely uptick in export performance.
Underpinning the rise in the Export Confidence Index is the significant rally of the Sales and New Orders Sub-Index, with its Current Performance level of 57.5 (up 19.6 points) and Expectation total of 59.4 (up 9.5 points). In other positive signs, both the Current (54.0) and Expectation (57.2) readings of the ProcurementSub-Index also exceeded the benchmark 50 level, indicating a likely upturn in procurement activity. In addition, exporters now hold (and plan to maintain) a higher than normal inventory level to meet rising sales and new orders. Less reassuringly, however, the Cost Sub-Index remained in negative territory in the case of both its Current and Expectation readings, an indication that upward cost pressures are yet to subside.
HKTDC Export Confidence Index | Current Performance | Expectation | ||
2Q24 | 1Q24 | 2Q24 | 1Q24 | |
Overall | 51.6 | 39.6 | 54.3 | 47.4 |
Sales and New Orders | 57.5 | 37.9 | 59.4 | 49.9 |
Trade Value (unit price) | 53.7 | 43.2 | 60.2 | 48.4 |
Cost (incl. materials, labour, finance & other operation costs)# | 31.8 | 32.0 | 33.0 | 34.9 |
Procurement | 54.0 | 40.7 | 57.2 | 45.3 |
Inventory# | 42.9 | 49.7 | 46.3 | 50.9 |
Note: # The Cost and Inventory sub-indices are inverted. Cost sub-index: A reading above 50 indicates a downward trend on costs, while a reading below 50 indicates an upward trend on costs. Inventory sub-index: A reading above 50 indicates a lower-than-normal inventory level, while a reading below 50 indicates a higher-than-normal inventory level. | ||||
Market outlook1
Moving to a more in depth look at the major markets, exporters were generally optimistic across the board. In specific terms, mainland China continued to be seen as the most promising market, with both its Current (60.5) and Expectation (62.2) readings rising to above 60. The US was then seen as the next most promising market, followed by the EU and the ASEAN bloc, with the Current and Expectation readings for all three markets well above the 50 threshold. In the case of Japan, meanwhile, while its market is not currently viewed positively, the relevant Expectation Sub Index has now shifted to expansionary territory.
Current Performance | Expectation | |||
2Q24 | 1Q24 | 2Q24 | 1Q24 | |
Sales and New Orders Sub-Index | 57.5 | 37.9 | 59.4 | 49.9 |
US | 53.6 | 34.5 | 57.1 | 47.1 |
EU | 53.5 | 36.8 | 55.7 | 46.1 |
Mainland China | 60.5 | 39.6 | 62.2 | 52.6 |
ASEAN | 52.7 | 36.0 | 52.8 | 42.0 |
Japan | 47.5 | 33.7 | 51.3 | 36.1 |
Others | 53.1 | 36.7 | 53.9 | 55.7 |
Industry outlook
Looking at the findings by industry sector, electronics exporters enjoyed the most positive current performance and outlook assessment, followed by jewellery and equipment / materials, with their improved Sales and New Orders prospects seen as driving exporter confidence. There were also signs of an upturn for the toys sector, while the readings for both clothing and timepieces remained below 50. In the case of the Trade Value Index, it was notable that clothing’s Current Trade Value reading had risen to a relatively high 62.5, perhaps reflecting that an upturn in prices is already underway. The Expectation levels for both electronics and toys, meanwhile, exceeds their previous readings (as well as the 60 mark), indicating a high likelihood of accelerating price rises in the coming quarter. It is also worth noting that Procurement activity in the electronics, toys, jewellery and equipment / materials sectors seems likely to continue to rise, as shown by the corresponding Current and Expectation indices now exceeding the 50 watermark level. Tuning to the Inventory Level, most sectors – with the exception of toys and timepieces – registered higher than normal inventory levels (<50) on both the Current Performance and Expectation indices. It also appears that high costs remain a primary constraint to export performance across all the major sectors.
Current Performance | Expectation | |||
2Q24 | 1Q24 | 2Q24 | 1Q24 | |
Overall | 51.6 | 39.6 | 54.3 | 47.4 |
Electronics | 52.4 | 39.9 | 55.0 | 48.1 |
Clothing | 48.7 | 34.9 | 48.1 | 43.0 |
Toys | 47.8 | 41.5 | 51.8 | 43.5 |
Jewellery | 52.0 | 31.6 | 53.0 | 39.5 |
Timepieces | 41.3 | 34.3 | 45.3 | 47.2 |
Equipment/materials | 51.0 | 36.1 | 52.5 | 45.4 |
Electronics | Clothing | Toys | Jewellery | Timepieces | Equipment/Materials | |||||||
Current | Expect | Current | Expect | Current | Expect | Current | Expect | Current | Expect | Current | Expect | |
Headline | 52.4 | 55.0 | 48.7 | 48.1 | 47.8 | 51.8 | 52.0 | 53.0 | 41.3 | 45.3 | 51.0 | 52.5 |
A. Sales & New Orders | 59.4 | 60.9 | 52.1 | 46.7 | 47.3 | 52.1 | 57.0 | 58.3 | 38.7 | 44.9 | 54.1 | 55.2 |
B. Trade Value (unit price) | 53.9 | 60.7 | 62.5 | 57.0 | 45.4 | 60.2 | 57.0 | 57.0 | 50.9 | 52.8 | 48.8 | 56.5 |
C. Cost # | 31.6 | 32.4 | 28.9 | 45.3 | 39.8 | 33.3 | 30.5 | 35.2 | 23.1 | 26.9 | 36.3 | 35.7 |
D. Procurement | 54.2 | 57.3 | 43.0 | 49.2 | 55.6 | 54.6 | 55.5 | 51.6 | 42.6 | 46.3 | 57.7 | 61.9 |
E. Inventory # | 41.6 | 46.0 | 46.7 | 46.7 | 52.8 | 57.5 | 45.3 | 46.9 | 58.8 | 56.9 | 48.7 | 45.5 |
Note: # The Cost and Inventory sub-indices are inverted. Cost sub-index: A reading above 50 indicates a downward trend on costs, while a reading below 50 indicates an upward trend on costs. Inventory sub-index: A reading above 50 indicates a lower-than-normal inventory level, while a reading below 50 indicates a higher-than-normal inventory level. | ||||||||||||
External and market issues
In 2Q24, the issue of rising transport costs overtook the risk represented by an economic slowdown / recession as the primary concern of exporters, while higher capital costs and exchange rate fluctuations were also seen as key challenges.
Challenges in the coming 12 months
2Q24 | 1Q24 | |
1 | Rising transport costs | Economic slowdown / recession in overseas markets |
2 | High capital costs | Rising transport costs |
3 | Exchange-rate fluctuations, currency devaluations in target markets | Geopolitical impact on supply chains and production / sourcing |
4 | Rising labour and production costs | Rising labour and production costs |
5 | \ | \ |
Looking ahead, traders expect business prospects to be boosted by the expansion of e commerce, the resumption of growth in many of the overseas markets, the wider deployment of AI and new technology, more effective supply chain management and the accelerated growth of demand across the mainland market.
Opportunities in the coming 12 months
2Q24 | |
1 | Widespread application of e-commerce |
2 | Overseas markets regaining momentum |
3 | Wider deployment of AI / new technology |
4 | Effective supply-chain management, reducing risks and controlling costs |
5 | Accelerated growth of mainland market demand |
In terms of their profitability outlook, the majority of exporters (73.0%) participating in the 2Q24 survey said they expected their profits to be higher (36.6%) or to stay about the same (36.4%) over the next 12 months, up from 55.9% (15.0% and 40.9%) in 1Q24, an indication of a more promising business outlook for 2024.
In other developments, a number of exporters indicated they had plans in place to deploy additional resources into marketing and promotional activities, as well as to increase their use of e commerce, while fewer respondents expressed concerns over restrictive cash flow management. Other popular business strategies included more flexible arrangements with regard to sales, product development and cuts in operational expenses.
Appendix
The HKTDC Export Confidence Index was introduced in 1Q24. It is a composite of five sub-indices – Sales and New Orders, Trade Value, Cost, Procurement and Inventory – and seeks to provide a comprehensive overview of Hong Kong exporter sentiment.
There are two primary / overall indices, one of which gauges the Current Performance in the present quarter, while the other considers the Expectation for the upcoming quarter via the weighted average of the following five sub-indices:
·Sales and New Orders: This is an indication of overall export performance as well as the level of new export orders received by respondents. This index is compiled based on respondents' feedback regarding the prospects of each of their major export markets.
·Trade Value: This focuses on tracking the movement of unit export prices.
·Cost: This tracks cost pressures as they relate to day-to-day operations, including raw material prices / labour and other operational costs/ financing requirements. Compared with the other indices, it is an inverted index, with an index reading above 50 indicating a downward trend for costs, while a reading below 50 indicates an upward trend for costs.
·Procurement: This is a measure of the input-buying activity of Hong Kong traders.
·Inventory: This tracks the overall inventory levels held by respondents for present use and the upcoming quarter. An index reading above 50 indicates a lower-than-normal inventory level, while a reading below 50 indicates a higher-than-normal inventory level.
1 Sales and New Orders Sub-Index is compiled from respondents' feedback regarding the prospects of their major export markets.
The HKTDC Export Confidence Index is designed to gauge the prospects of the near-term export performance of Hong Kong traders. To deliver on this, a quarterly survey of 500+ Hong Kong traders from six major industry sectors is conducted. Any index reading above 50 indicates an upward trend and an optimistic outlook, while any index reading below 50 indicates a downward trend and a pessimistic outlook.
As this is a new Index, which debuted in 1Q24, its findings cannot be directly compared with those of earlier studies.


















First, please LoginComment After ~