Global situation of undertakings for collective investment at the end of June 2024
I. Overall situation
As at 30 June 2024, the total net assets of undertakings for collective investment, comprising UCIs subject to the 2010 Law, specialised investment funds and SICARs, amounted to EUR 5,582.271 billion compared to EUR 5,472.493 billion as at 31 May 2024, i.e. an increase of 2.01% over one month. Over the last twelve months, the volume of net assets increased by 7.40%.
The Luxembourg UCI industry thus registered a positive variation amounting to EUR 109.778 billion in June. This increase represents the sum of positive net capital investments of EUR 25.859 billion (+0.47%) and of the positive development of financial markets amounting to EUR 83.919 billion (+1.54%).
The development of undertakings for collective investment is as follows:
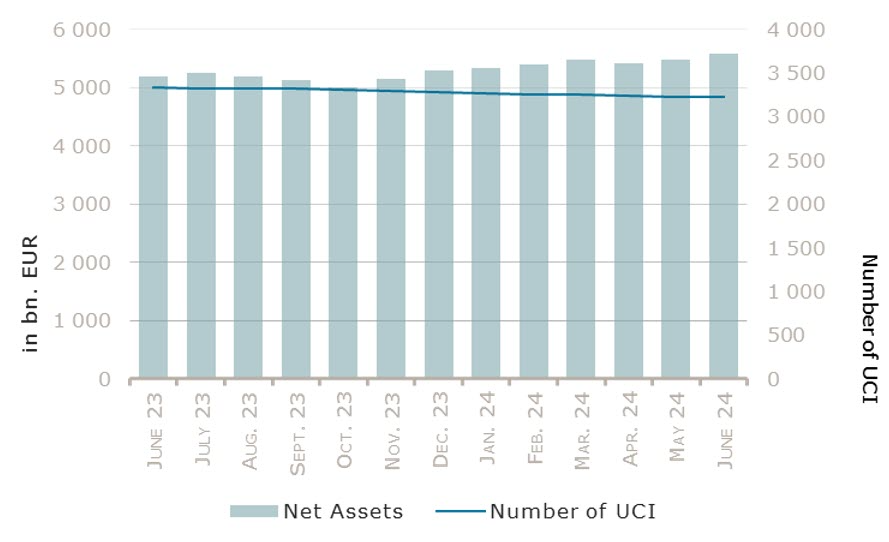
The number of undertakings for collective investment taken into consideration totalled 3,228, against 3,232 the previous month. A total of 2,114 entities adopted an umbrella structure representing 12,724 sub-funds. Adding the 1,114 entities with a traditional UCI structure to that figure, a total of 13,838 fund units were active in the financial centre.
As regards the impact of financial markets on the main categories of undertakings for collective investment and the net capital investment in these UCIs, the following can be said for the month of June.
During the month, markets continued to be focused on monetary policy and inflation. While the ECB proceeded as expected to a first 25 bps rate cut in the beginning of the month – with no commitment to further rapid cuts, the Fed and the Bank of England kept their reference rates unchanged during their June meetings. On the economic front, data suggested a slowing of the global economy raising hopes for a further decline in inflation and a normalisation of monetary policies.
In that context, US equity markets delivered the largest monthly performance, once again supported by strong demand for IA and technology stocks. The Asian and Japanese equities also benefitted from significant exposure to those stocks from countries such as Taiwan and South Korea. European equities, on the contrary, posted losses mainly due to political uncertainty in France following the unexpected decision of the French President to call early parliamentary elections after the defeat of the ruling party in the European parliamentary elections. Finally, Latin American equities reported the largest losses, following a significant market decline and a strong currency depreciation both in Mexico, following the national elections which raised concerns of potential upcoming tax hikes, and in Brazil, amid a negative market sentiment.
In June, equity UCI categories registered an overall stable capital investment, with limited outflows in most categories offset by inflows in the Japanese and Other equities categories.
Development of equity UCIs during the month of June 2024*
|
Market variation in % |
Net issues in % | |
| Global market equities |
2.57% |
-0.01% |
| European equities |
-1.13% |
-0.03% |
| US equities |
5.09% |
-0.35% |
| Japanese equities |
1.56% |
0.22% |
| Eastern European equities |
1.47% |
-0.80% |
| Asian equities |
3.18% |
-0.52% |
| Latin American equities |
-5.31% |
-1.71% |
| Other equities |
2.78% |
0.57% |
* Variation in % of Net Assets in EUR as compared to the previous month
All the fixed income UCIs categories reported positive returns as a result of a decrease in bond yields, given the negative relationship between yields and bond prices, which was however partially offset by a slight increase in credit spreads. Returns also benefitted from the appreciation of the US dollar and most other major currencies against the EUR.
In June, all fixed income and money market UCIs categories registered positive net capital investment. The largest inflows were reported by the UCI categories EUR money market and Emerging market bonds.
Development of fixed income UCIs during the month of June 2024*
|
Market variation in % |
Net issues in % | |
| EUR money market |
0.27% |
6.46% |
| USD money market |
1.46% |
0.62% |
| Global money market |
0.81% |
1.56% |
| EUR-denominated bonds |
0.57% |
1.21% |
| USD-denominated bonds |
1.64% |
0.15% |
| Global market bonds |
0.93% |
0.33% |
| Emerging market bonds |
0.70% |
6.43% |
| High Yield bonds |
1.07% |
0.64% |
| Others |
1.03% |
0.55% |
* Variation in % of Net Assets in EUR as compared to the previous month
The development of net assets of diversified Luxembourg UCIs and funds of funds is illustrated in the table below:
Development of diversified UCIs and funds of funds during the month of June 2024*
|
Market variation in % |
Net issues in % | |
| Diversified UCIs |
1.49% |
0.10% |
| Funds of funds |
1.34% |
0.06% |
* Variation in % of Net Assets in EUR as compared to the previous month










First, please LoginComment After ~