Global situation of undertakings for collective investment at the end of September 2024
I. Overall situation
As at 30 September 2024, the total net assets of undertakings for collective investment, comprising UCIs subject to the 2010 Law, specialised investment funds and SICARs, amounted to EUR 5,659.544 billion compared to EUR 5,638.940 billion as at 31 August 2024, i.e. an increase of 0.37% over one month. Over the last twelve months, the volume of net assets increased by 10.58%.
The Luxembourg UCI industry thus registered a positive variation amounting to EUR 20.604 billion in September. This increase represents the sum of negative net capital investments of EUR 27.297 billion (-0.48%) and of the positive development of financial markets amounting to EUR 47.901 billion (+0.85%).
The development of undertakings for collective investment is as follows:
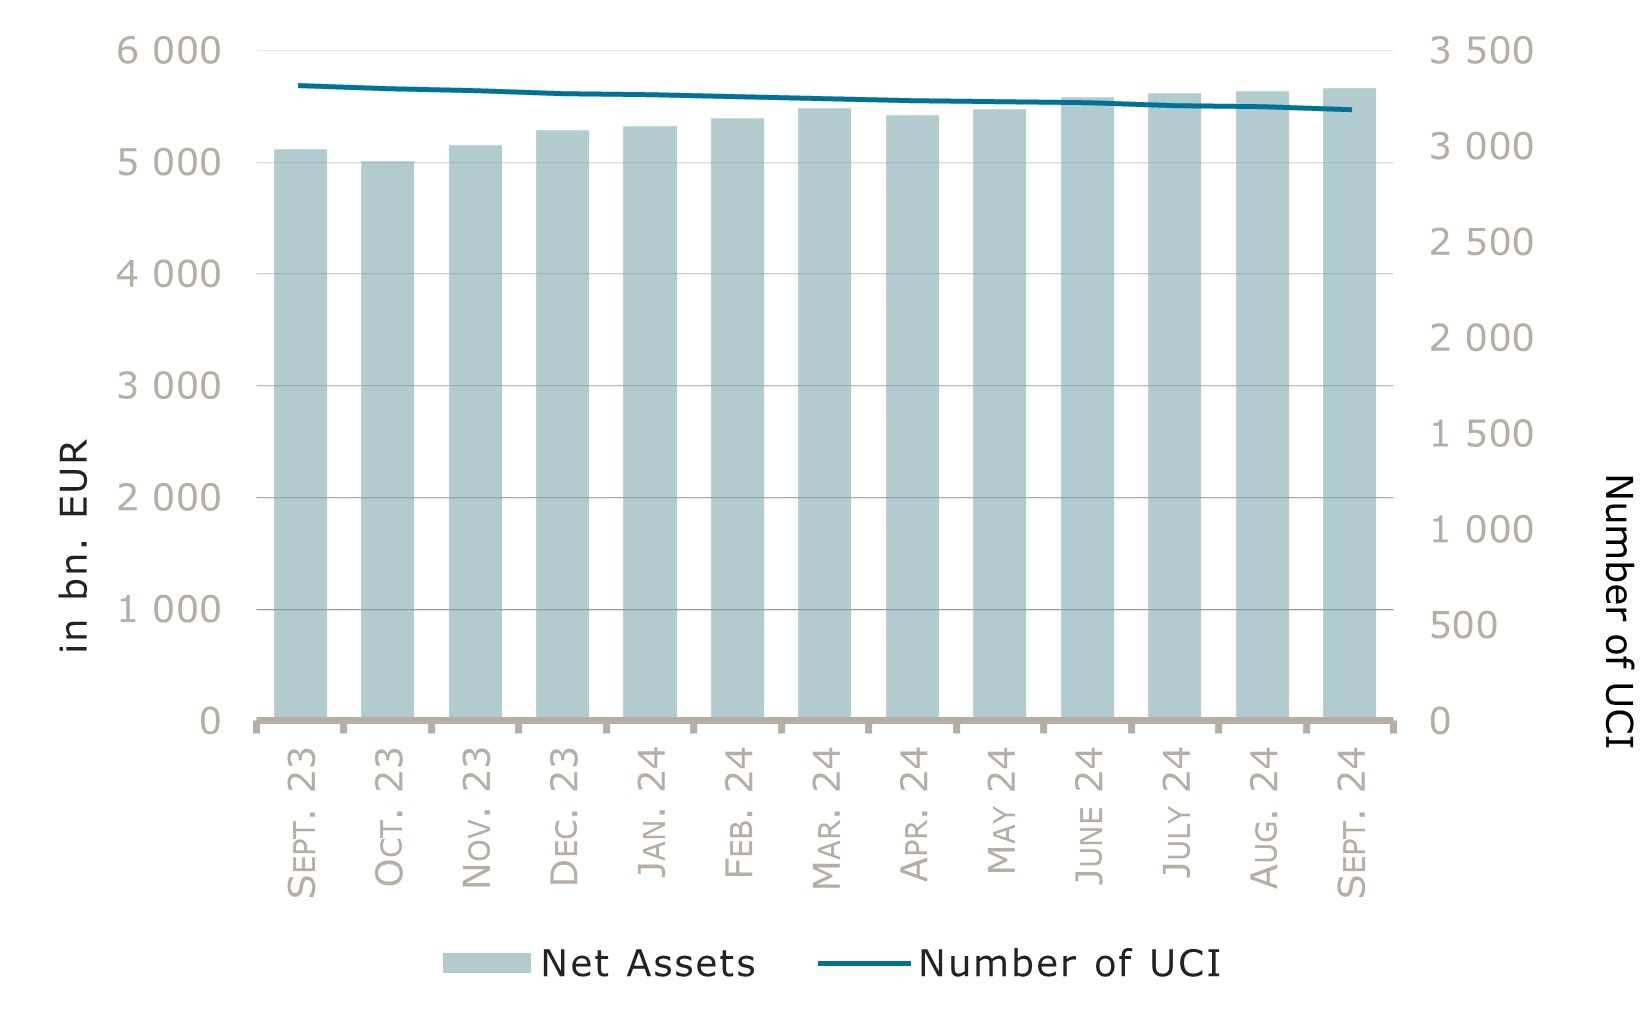
The number of undertakings for collective investment taken into consideration totalled 3,194, against 3,205 the previous month. A total of 2,094 entities adopted an umbrella structure representing 12,623 sub-funds. Adding the 1,100 entities with a traditional UCI structure to that figure, a total of 13,723 fund units were active in the financial centre.
As regards the impact of financial markets on the main categories of undertakings for collective investment and the net capital investment in these UCIs, the following can be said for the month of September.
The most notable event during the month is the large positive performance reported by the Asian equities UCI category, which was driven by a surge in Chinese equities, following the announcement of a significant stimulus package by the Chinese central bank, the most significant one since the COVID crisis, which includes interest rates cuts, reducing reserve requirements for banks and support for the housing sector. The other equity UCI categories reported mixed performances, in the absence of any new significant economic development (with the exception of monetary policy decisions, as detailed below, which were however widely anticipated).
In September, most equity UCI categories registered negative capital investment. The largest outflows were reported by the Latin American and Eastern European equities categories.
Development of equity UCIs during the month of September 2024*
Market variation in % | Net issues in % | |
| Global market equities | 0.80% | -0.28% |
| European equities | 0.02% | -0.30% |
| US equities | 0.93% | 0.20% |
| Japanese equities | -0.54% | -1.22% |
| Eastern European equities | -1.20% | -2.14% |
| Asian equities | 9.67% | 0.21% |
| Latin American equities | -0.84% | -2.19% |
| Other equities | 3.02% | -0.91% |
* Variation in % of Net Assets in EUR as compared to the previous month
The performance of fixed income UCIs was mostly positive, supported by a decrease in interest rates (given the negative relationship between yields and prices) driven by a second consecutive 25 bps interest rate cut by the ECB and a 50 bps cut by the Fed (the first cut in more than four years), as well as expectations of further monetary easing supported by dovish comments from officials and positive data on inflation. USD money market and USD-denominated bonds however incurred losses, mostly explained by the depreciation of the US dollar against most currencies, including the Euro, due to higher expectations of monetary policy easing by the Fed.
In September, fixed income UCIs registered mixed net capital investment. The largest changes are outflows for the Global market bonds UCI category.
Development of fixed income UCIs during the month of September 2024*
Market variation in % | Net issues in % | |
| EUR money market | 0.25% | -0.95% |
| USD money market | -0.85% | -0.51% |
| Global money market | 0.49% | -1.80% |
| EUR-denominated bonds | 1.10% | 0.48% |
| USD-denominated bonds | -2.50% | 0.61% |
| Global market bonds | 0.82% | -3.95% |
| Emerging market bonds | 1.45% | -0.72% |
| High Yield bonds | 0.68% | 0.25% |
| Others | 0.76% | 1.51% |
* Variation in % of Net Assets in EUR as compared to the previous month
The development of net assets of diversified Luxembourg UCIs and funds of funds is illustrated in the table below:
Development of diversified UCIs and funds of funds during the month of September 2024*
Market variation in % | Net issues in % | |
| Diversified UCIs | 0.81% | 0.04% |
| Funds of funds | 1.08% | 0.22% |
* Variation in % of Net Assets in EUR as compared to the previous month













First, please LoginComment After ~