


HKTDC Export Confidence Index 1Q25: Export Confidence Improves Despite Growing Trade Tensions(Part1)
Key Findings
·The 1Q25 HKTDC Export Confidence Index shows Hong Kong exporters remain optimistic amid the escalation in trade tensions between the US and its major trade partners.
·The optimism has been underpinned by a broad-based improvement in sales/new orders, procurement activity and sales prices.
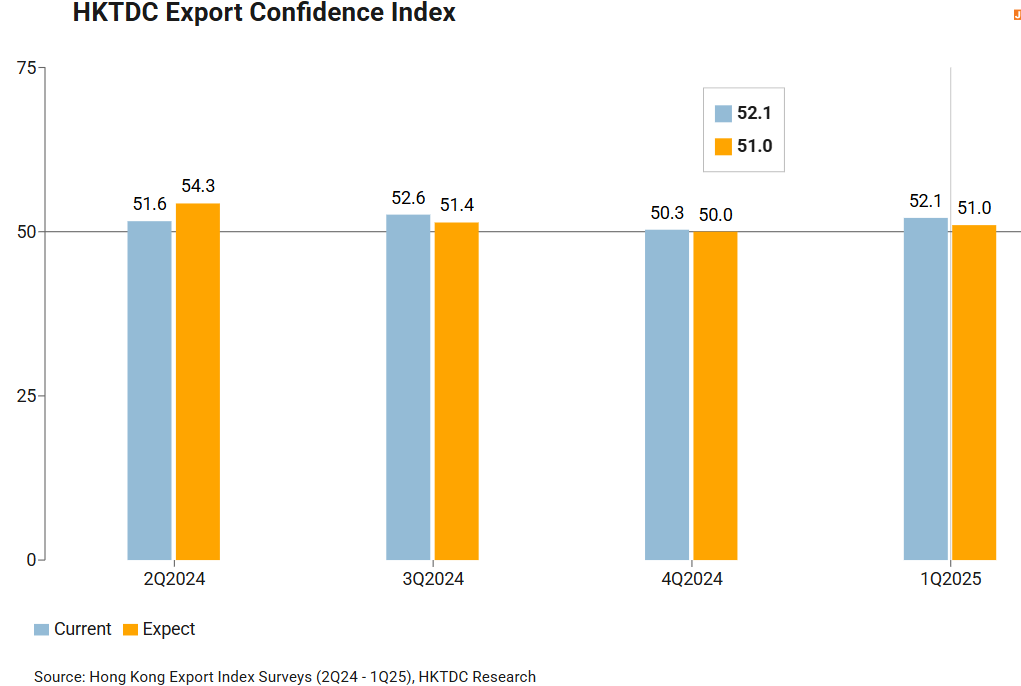
oBoth the Current Performance Index (at 52.1) and the Expectation Index (51.0) improved and stayed firmly above 50.
oThe Current Performance Index rose by 1.8 points, driven mainly by positive outcomes for both the Sales and New Orders Sub-Index (56.2, up 2.9) and Procurement Sub-Index (58.1, up 5.9). The Trade Value Sub-Index stayed in expansionary territory, at 54.9 (down 0.2), while Cost pressures (28.5, down 4.3) had a negative impact on exporter confidence.
oThe Expectation Index reading, meanwhile, was up by 1.0 to 51.0. Improvements were seen in the Sales and New Orders (53.8, up 1.0), the Trade Value (53.9, up 1.3) and the Procurement (53.8, up 2.7) sub-indices. The Cost Sub-Index, however, showed a marginal decrease of 0.4 points, falling to 34.4.
·In terms of Hong Kong's major export markets, exporter sentiment is most positive with regard to Mainland China and the ASEAN bloc. In all, traders considered Mainland China as the most promising market, with both its Current Performance (59.0) and Expectation (55.7) higher than any other. Meanwhile, Current Performance (56.4) and Expectation (53.0) for ASEAN remained comfortably in expansionary territory. The tariff hikes now in force with regard to many of its major trading partners have reduced exporter confidence in the US, with its Current Performance (47.8, down 3.1) falling below 50 for the first time in a year and its Expectation level at a one-year low of 46.7.
In terms of individual industries, Jewellery (53.1), Electronics (52.3) and Timepieces (51.2) had the best Current Performance. In terms of Expectation, meanwhile, five out of six sectors enjoyed an improving outlook. Jewellery (54.4), Equipment/Materials (52.6) and Timepieces (51.1) were the most optimistic when it came to future performance, while Toys (50.7) and Electronics (50.6) similarly remained in the expansion zone.
·Also worth noting is that exporters remained optimistic about the need to raise prices in order to counter lingering cost pressures, with the Trade Value Expectation Sub-Index well above 50 in almost every sector.
·Apart from compiling the standard index data, the 1Q25 survey addressed several thematic trade-related issues, including the challenges faced by exporters and their counterparts. The key findings here were:
oIn response to the new round of higher US tariffs, the highest proportion of traders favoured diversifying sourcing (46.8%) as the most appropriate strategy, followed by expansion into new markets (39.7%).
oThe majority of respondents (75.4%) also anticipated that their profit margins would increase or remain stable, a slight rise on the 72.1% sharing the same sentiment in 4Q24, and the highest for a year.
Index overview
The latest 1Q25 HKTDC Export Confidence Index showed Hong Kong exporters’ sentiment remained positive amid the escalation in trade tension between the US and its major trade partners.1 Both the Current Performance Index (at 52.1) and the Expectation Index (51.0) improved and stayed firmly above 50, after the wait‑and‑see approach that characterised 4Q24.
Sub-indices
The sub indices provide a more comprehensive insight into many of the underlying factors impacting exporter confidence.
The Current Performance Index rose by 1.8 points, driven mainly by a strong Sales and New Orders Sub-Index (56.2, up 2.9) and an equally robust Procurement Sub-Index (58.1, up 5.9). The Trade Value Sub-Index stayed in expansionary territory, at 54.9 (down 0.2), while Cost pressures (28.5, down 4.3) further dragged on exporter confidence. The Inventory Sub-Index hovered around 50, indicating inventory levels were normal.
The reading of the Expectation Index increased slightly by 1.0 to 51.0. Improvements were seen to the Sales and New Orders Sub-Index (53.8, up 1.0) and the ProcurementSub-Index (53.8, up 2.7). The Trade Value Sub-Index also stayed firm in the expansionary zone (53.9, up 1.3). The Cost Sub-Index continued to be the major tug, with a marginal decrease of 0.4 points to 34.4. TheInventory Sub-Index hovered around 50, indicating inventories were at normal levels.
HKTDC Export Confidence Index | CurrentPerformance | Expectation | ||||||
1Q25 | 4Q24 | 3Q24 | 2Q24 | 1Q25 | 4Q24 | 3Q24 | 2Q24 | |
Overall | 52.1 | 50.3 | 52.6 | 51.6 | 51.0 | 50.0 | 51.4 | 54.3 |
Sales and New Orders | 56.2 | 53.3 | 55.7 | 57.5 | 53.8 | 52.8 | 54.6 | 59.4 |
Trade Value (unit price) | 54.9 | 55.1 | 56.2 | 53.7 | 53.9 | 52.6 | 51.7 | 60.2 |
Cost (incl. materials, labour, finance and other operation costs)# | 28.5 | 32.8 | 34.8 | 31.8 | 34.4 | 34.8 | 35.9 | 33.0 |
Procurement | 58.1 | 52.2 | 57.3 | 54.0 | 53.8 | 51.1 | 55.4 | 57.2 |
Inventory# | 50.4 | 49.3 | 49.8 | 42.9 | 50.6 | 50.6 | 49.7 | 46.3 |
Note: # The Cost and Inventory sub-indices are inverted. Cost sub-index: A reading above 50 indicates a downward trend on costs, while a reading below 50 indicates an upward trend on costs. Inventory sub-index: A reading above 50 indicates a lower-than-normal inventory level, while a reading below 50 indicates a higher-than-normal inventory level. | ||||||||
Market outlook
For Hong Kong’s major export markets, the Current Performance readings of Mainland China (59.0, up 6.7) and ASEAN (56.4, down 2.7) remained strong.2 The tariff hikes the US imposed on its trade partners over recent months have drained exporter confidence in the US, with its reading (47.8, down 3.1) dropping below 50 for the first time in a year. The EU (50.1) rose by 3.8 points, taking it above the neutral level of 50, while Japan dropped slightly to 47.5 (down 2.5).
The Expectation Index pointed to a positive outlook for all markets, except the US. The uncertainties of the ongoing trade tensions further undermined exporter prospects in the US, with the Expectation reading at a one year low of 46.7 (down 4.3). By contrast, Mainland China (55.7, up 3.0) and ASEAN (53.0, down 2.9) appeared more promising markets. The EU also bounced back significantly with an increase of 9.5 to 52.7. In the case of Japan, meanwhile, a more positive reading of 50.6 (up 2.9) was recorded.
Current Performance | Expectation | |||||||
1Q25 | 4Q24 | 3Q24 | 2Q24 | 1Q25 | 4Q24 | 3Q24 | 2Q24 | |
Sales and New Orders Sub-Index # | 56.2 | 53.3 | 55.7 | 57.5 | 53.8 | 52.8 | 54.6 | 59.4 |
US | 47.8 | 50.9 | 51.5 | 53.6 | 46.7 | 51.0 | 48.5 | 57.1 |
EU | 50.1 | 46.3 | 53.1 | 53.5 | 52.9 | 43.4 | 46.9 | 55.7 |
Mainland China | 59.0 | 52.3 | 58.2 | 60.5 | 55.7 | 52.7 | 58.4 | 62.2 |
ASEAN | 56.4 | 59.1 | 60.2 | 52.7 | 53.0 | 55.9 | 59.7 | 52.8 |
Japan | 47.5 | 50.0 | 52.5 | 47.5 | 50.6 | 47.7 | 46.7 | 51.3 |
Others | 54.9 | 60.2 | 56.1 | 53.1 | 50.5 | 56.9 | 49.2 | 53.9 |
Note: #The Sales and New Orders Sub-Index is compiled from respondents' feedback regarding the prospects for their major export markets. | ||||||||


First, please LoginComment After ~