


2025 Mid-Year Export Review and Outlook: Global Trade Talk Progress Sees HKTDC Adhere to 3% Export Growth Forecast
Despite comprising an almost unprecedented period of global trade turbulence, as 2025 approaches its halfway point, HKTDC Research is adhering to its earlier forecast that Hong Kong's export levels will rise by 3% for the year as a whole. This is in line with its expectation that this will be very much a year of two halves, with the first six months characterised by increased trade activity, followed by a sharp deceleration that could run into the first quarter of 2026.
The unique factors that have shaped this year's unusual trade development pattern stem, of course, from the drastic shift in US trade policy and, in particular, its wide deployment (or threat) of substantial tariffs on imports from many of its trading partners. Originally scheduled to come into effect on 9 April this year, a 90 day pause was later announced for all of the country's trading partners with the exception of Mainland China (including Hong Kong). On 12 May, an announcement confirmed that both the US and Mainland China would pause their respective tariff regimes for 90 days. On 11 June, the two nations reached a mutual trade agreement framework in London, although details have yet to be confirmed.
While the trade negotiations continue, the heightened uncertainty has inevitably undermined consumer and business confidence. Hong Kong exporters, of course, have not been immune to such concerns, as indicated by the findings of the recently released HKTDC2Q25 Export Confidence Index. It showed that both of its key metrics – the Current Performance Index (49.6) and the Expectation Index (49.0) – had fallen below the crucial watershed level of 50 for the first time in a year.
Hong Kong Export Landscape
Despite the moderately downbeat findings of the 2Q25 Export Confidence Index, there are a number of encouraging underlying factors that should allow Hong Kong exporters to weather the US tariffs relatively unscathed whatever the outcome of the ongoing trade negotiations.
1. Relatively low exposure to the US market
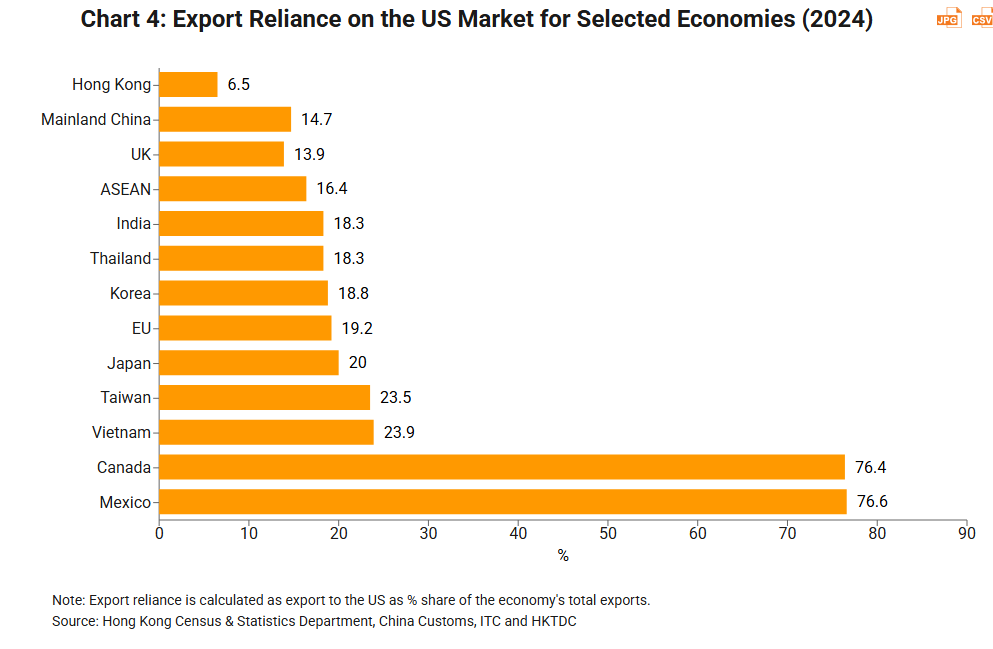
Firstly, both Mainland China and Hong Kong have relatively low exposure to the US market when compared with other economies. In 2024, US bound exports accounted for just 6.5% of Hong Kong's total merchandise exports, while the corresponding Mainland China figure was slightly higher at 14.7%.
2. Robust trade ties with other markets
Secondly, Hong Kong's enhanced trade connections with a number of key markets (notably the ASEAN bloc and the Middle East) are seen likely to buoy its current and future export performance. As an indication of this, between 2017 and 2024, although Hong Kong's exports to the US decreased by 10.5%, this was more than compensated for by the increased exports to the ASEAN bloc (38.5%) and the Middle East (58.1%). This resulted in a 17.2% increase in total exports for the period.
3. Diversified sourcing networks
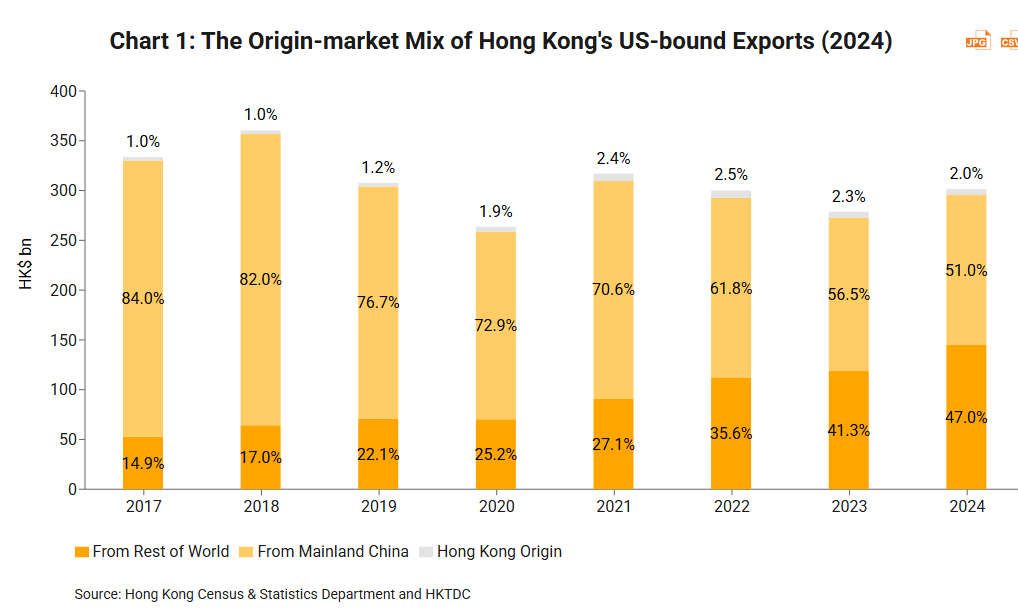
Thirdly, over recent years, Hong Kong exporters and traders have prioritised diversifying their sourcing locations in line with the so called China+1 or China+N strategies. This approach was initiated during Trump's first term in office in a bid to mitigate the impact of his initial tranche of Mainland China targeted tariffs. As a consequence, many of Hong Kong's US bound exports are now sourced from different locales than they were in 2017. In fact, in 2024, nearly half of Hong Kong's US bound exports were originated from a variety of international sources, notably up on the comparable figure of 15% eight years ago (see Chart 1).
Cross-sector US tariff vulnerability varies
In another telling statistic, should the reciprocal tariff regime against Mainland China (including Hong Kong) be reinstated, only 3.4% of Hong Kong's total exports would fall within its remit (without taking into account of products eligible for tariff exemptions). It is, however, fair to say that vulnerability to US tariffs varies considerably from sector to sector.
In the case of electronics – a sector that accounts for more than 70% of Hong Kong's total exports – this remains relatively unaffected by the tariffs. In all, Hong Kong's electronics exports to the US comprised just 5.2% of its total electronics exports in 2024, with 55.3% of the relevant items sourced from Mainland China and only 0.1% locally made (See Table 1). The upshot of this is that only about 2.9% of Hong Kong's total electronic exports would be subject to the tariffs targeting Mainland China. If the tariff exemptions on semiconductors and smartphones are factored in, a merely 1.1% of Hong Hong's total electronic exports would be subject to the tariffs. Many of the city's other key export sectors – including clothing, jewellery and toys – are, however, more vulnerable to the US tariffs.
Table 1: Tariffs Vulnerability by Key Sectors (2024) | ||||
US market exposure | From Mainland China | From Hong Kong | From Rest of World | |
Electronics | 5.2% | 55.3% | 0.1% | 44.6% |
Fine Jewellery | 20.7% | 33.2% | 24.0% | 42.8% |
Clothing | 21.3% | 89.1% | 4.1% | 6.8% |
Watches & Clocks | 16.8% | 31.4% | 0.1% | 68.5% |
Toys & Games | 14.7% | 91.7% | 2.0% | 6.3% |
Others | 8.3% | 42.1% | 1.5% | 56.4% |
Total | 6.5% | 51.0% | 2.0% | 47.0% |
Source: Hong Kong Census & Statistics Department and HKTDC | ||||
HKTDC Research's decision to retain its March 2025 forecast of 3.0% export growth for the year as a whole took into account of the above factors. It also holds on to its view that the overall export performance will weaken sharply in the second half and possibly even last into the first quarter of next year. This is largely because of the front loading strategy, which saw many exporters complete shipments early in the hope of avoiding the anticipated tariffs.
Hong Kong's Exports Four-Month Overview
Electronics exports continue to drive overall growth
Turning now to the actual trading performance over the first four months of 2025, Hong Kong's exports grew by 11.9% yoy, a notable uptick on the 8.7% increase recorded in 2024 (See Chart 2). This robust performance can largely be attributed to sustained demand for AI enabled electronic devices (especially computer equipment and related items), along with the front loading shipments strategy adopted by many businesses in expectation of the change in US tariff policy (See Table 2).
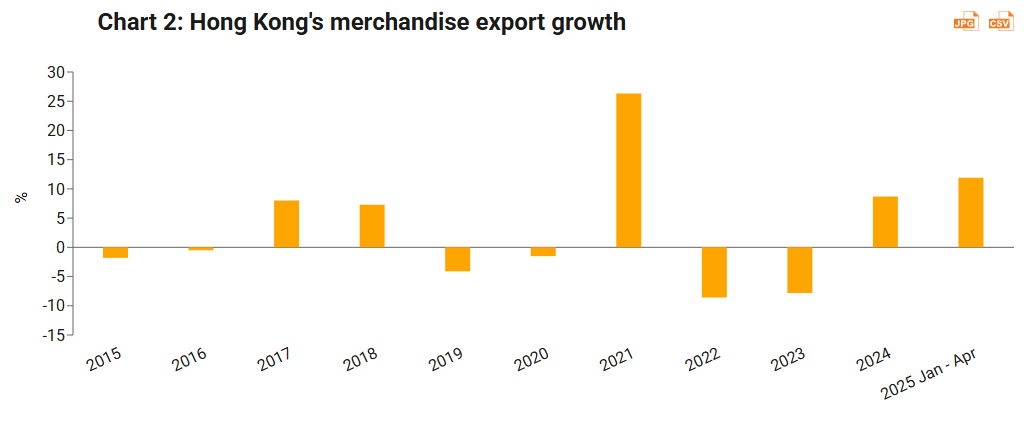
Table 2: Hong Kong's Exports by Key Sectors | ||||
2024 | 2025 Jan-Apr | |||
HK$ mn | YoY Change | HK$ mn | YoY Change | |
Electronics | 3,307,138 | 12.5% | 1,200,622 | 17.5% |
- Finished Products | 789,056 | 16.4% | 308,718 | 26.8% |
- Parts & Components | 2,518,082 | 11.3% | 891,904 | 14.6% |
Fine Jewellery | 80,500 | -8.3% | 26,291 | -7.1% |
Watches & Clocks | 48,790 | -10.5% | 15,644 | -6.0% |
Clothing | 49,298 | -3.7% | 14,152 | -4.4% |
Toys & Games | 13,685 | -21.8% | 4,724 | 16.1% |
Total | 4,542,371 | 8.7% | 1,605,032 | 11.9% |
Source: Hong Kong Census & Statistics Department and HKTDC | ||||
Mixed performance across major export markets
When considering the performance of the city's key export markets, a somewhat mixed picture emerges (see Table 3). Reassuringly, exports to Mainland China and the ASEAN bloc – the two most significant recipients of Hong Kong exports – continued to record double digit growth (18.1% and 24.8% yoy, respectively). By contrast, there was a notable slowdown in the growth of US destined exports, which decelerated to 3.1% yoy in the first four months. The trend is more notable if we look at the monthly trade figures, which show that Hong Kong's exports to the US fell to a 1.0% yoy growth in April, after growing 11.4% yoy in March.
Table 3: Hong Kong's Exports by Key Markets | ||||
2024 | 2025 Jan-Apr | |||
HK$ mn | YoY Change | HK$ mn | YoY Change | |
US | 295,571 | 8.5% | 98,192 | 3.1% |
EU | 275,674 | 0.7% | 80,928 | -8.4% |
Mainland China | 2,681,658 | 15.6% | 970,652 | 18.1% |
ASEAN | 393,426 | 18.7% | 153,759 | 24.8% |
Taiwan | 140,415 | 1.1% | 61,757 | 36.3% |
India | 137,022 | -18.0% | 43,569 | -12.9% |
Japan | 80,656 | -4.4% | 27,287 | 0.6% |
Korea | 68,816 | -6.6% | 21,002 | -13.0% |
Middle East | 129,547 | -5.2% | 36,730 | -24.6% |
Latin America | 82,957 | 11.9% | 28,160 | 2.9% |
Total | 4,542,371 | 8.7% | 1,605,032 | 11.9% |
Source: Hong Kong Census & Statistics Department and HKTDC | ||||
2025 Global Export Outlook
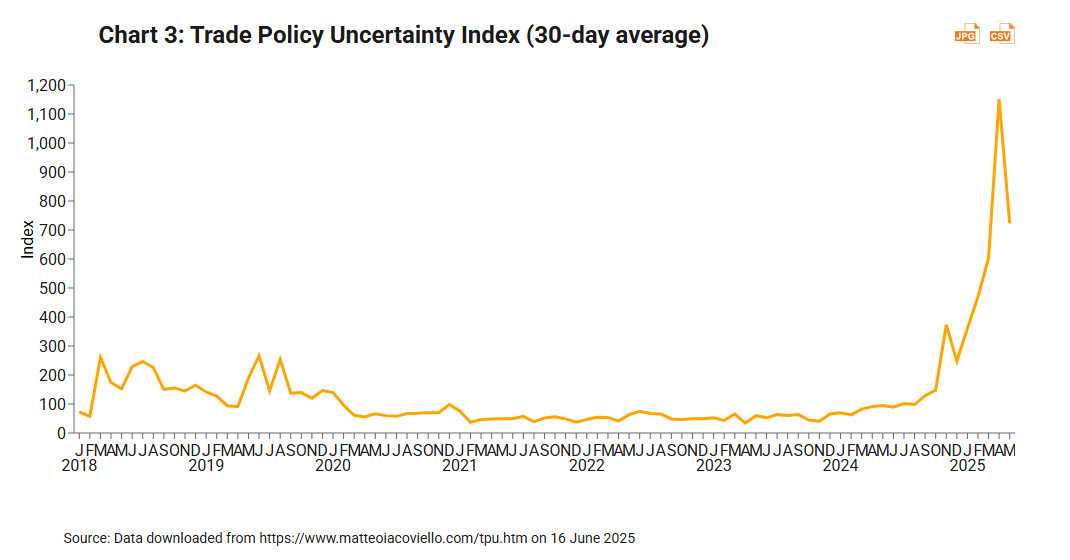
Looking beyond Hong Kong, it is clear that the above mentioned US trade policy developments have led to increased global trade uncertainty, an outcome reflected in the Trade Policy Uncertainty (TPU) Index1, a metric that has soared to unprecedent levels and remained elevated over recent months (see Chart 3).
Global trade uncertainty is expected to remain high at least until trade negotiations between the US and its trade partners reach some kind of conclusion. Of particular concern is whether or not the US could reach a trade agreement with all of its key trade partners during the 90 day hiatus. This lack of clarity will inevitably result in businesses postponing operational decisions, reassessing supply chain strategies and committing to more comprehensive risk management initiatives. If such uncertainty persists, it could also impair the ability of businesses to commit to long term plans, which could also fundamentally reshape global trade patterns.
US tariff measures set to weigh on global trade
As an indication of the likely global impact of the US tariff measures, the World Trade Organisation (WTO) reversed its world merchandise trade forecast in an April 2025 update2. Its revised estimate now indicates that the volume of world merchandise trade is expected to decline by 0.2% in 2025, markedly down from its previous expectation of 2.7% growth (See Table 4).
Table 4: WTO's Latest Projections on Merchandise Trade Volume Growth | |||||||
Oct 24 | Apr 25 | ||||||
Baseline Forecast (a) | Adjusted Forecast (b) | Difference (b)-(a) | |||||
2024 | 2025 | 2026 | 2025 | 2026 | 2025 | 2026 | |
World Trade | 2.9% | 2.7% | 2.9% | -0.2% | 2.5% | -2.9% | -0.4% |
Exports | |||||||
North America | 2.3% | 2.2% | 2.9% | -12.6% | -1.2% | -14.8% | -4.1% |
South America | 6.2% | 1.4% | 1.2% | 0.6% | 0.9% | -0.8% | -0.2% |
Europe | -1.7% | 1.4% | 2.3% | 1.0% | 2.5% | -0.3% | 0.2% |
CIS | 2.3% | 4.0% | -0.1% | 4.4% | 0.1% | 0.4% | 0.1% |
Africa | 1.3% | 0.5% | 1.6% | 0.6% | 1.7% | 0.1% | 0.1% |
Middle East | 3.7% | 5.2% | 5.0% | 5.3% | 5.1% | 0.1% | 0.0% |
Asia | 8.0% | 3.3% | 3.3% | 1.6% | 3.5% | -1.7% | 0.1% |
Imports | |||||||
North America | 4.7% | 2.8% | 1.6% | -9.6% | -0.8% | -12.5% | -2.4% |
South America | 6.7% | 6.0% | 1.0% | 5.0% | 0.5% | -1.0% | 0.5% |
Europe | -2.2% | 2.1% | 2.7% | 1.9% | 2.7% | -0.3% | 0.0% |
CIS | -5.0% | 0.1% | 2.1% | 0.5% | 2.1% | 0.3% | 0.0% |
Africa | 1.8% | 6.2% | 5.4% | 6.5% | 5.3% | 0.3% | 0.0% |
Middle East | 15.0% | 6.3% | 6.8% | 6.3% | 6.7% | 0.1% | -0.1% |
Asia | 4.4% | 3.2% | 3.8% | 1.6% | 3.8% | -1.6% | 0.0% |
Source: WTO | |||||||
Despite the considerable downward adjustment of global trade expansion, growth is still expected to persist in every part of the world in terms of both exports and imports, with the exception of North America. In specific terms, North America is expected to register a decline of 12.6% in its exports and 9.6% in terms of imports.
This sharp deterioration of trade activity across North America is not surprising, given that the strong trade ties with the US have made Canada and Mexico particularly vulnerable to the tariff hikes. In 2024, US bound exports accounted for 76.4% of Canada's and 76.6% of Mexico's total merchandise exports, with both figures substantially higher than those for other US trading partners (See Chart 4).
Conclusion
All in all, the lingering uncertainties surrounding US trade policy represent a major challenge for the global economy in the near term. It is, however, worth bearing in mind that Hong Kong's reduced export exposure to the US market, stronger trade ties with other markets, and its more diversified sourcing network are all helping to mitigate the direct impact of the US tariffs. At the same time, though, the indirect impact of tariff hikes – including supply chain disruptions and a global economic slowdown – may well prove a real challenge.
Hong Kong exporters also need to bear in mind the medium and longer term trends. The recent shift in US international trade policy has created heightened uncertainty for international trade and global business, while prompting global companies to rethink their supply chains and strategic business planning as they look to better serve the world's two biggest markets in these rapidly evolving new circumstances.
1 The TPU index is constructed by staff in the International Finance Division of the Federal Reserve Board and measures media attention to news related to trade policy uncertainty. The index is scaled so that 100 indicates that 1% of news articles contain references to TPU.
2 Global Trade Outlook and Statistics, WTO, April 2025.


First, please LoginComment After ~